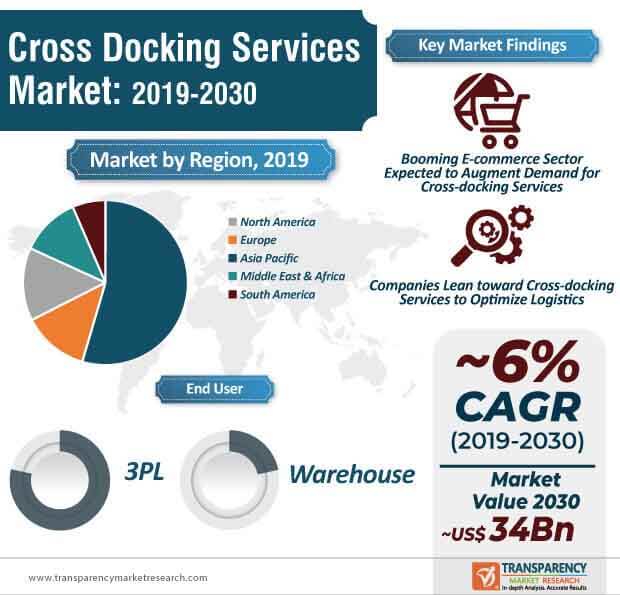
Over the past couple of decades, globalization and industrialization have played a key role in transforming supply chain models and logistics across the perishable goods space. Logistics strategies have evolved with advancements in technology, as companies continue to seek different ways to optimize their supply chain framework of certain food products with a limited life span. In recent years, the pursuit of efficient transportation and logistics in the food & beverages sector has led to the adoption of cross-docking services. Cross-docking services are increasingly being utilized across the flourishing e-Commerce sector across the world to minimize delivery times– a factor that is expected to provide a solid foundation for growth of the global cross docking services market during the forecast period.
The logistics sector is evolving at a rapid pace, owing to several factors, including advancements in technology, evolving consumer habits, and the booming e-Commerce sector. Warehouse processes and management techniques have also witnessed considerable transformation over the past decade due to which, cross-docking services are likely to gain considerable traction in the upcoming years. While some companies rely on cross-docking services upon requirement, several companies are increasingly deploying cross-docking services on a permanent basis. Cross-docking services are increasingly being used across a host of industrial sectors, including food & beverages, automotive, pharmaceuticals, paper, pulp, defense & aerospace, and healthcare. At the back of these factors, the global cross docking services market is expected to attain a market value of ~US$ 340 Bn by the end of 2030.
Order fulfilling techniques have come a long way over the past few decades. At present, cross docking has emerged as an effective strategy that is increasingly being deployed for distribution and logistics operations of consumer goods. Several companies around the world are using cross-docking services to enhance their warehousing operations. Companies operating in the pharmaceutical sector wherein mass distribution is critical are relying on cross-docking services to strengthen their foothold in the cross docking services market.
For instance, Roche Diagnostics, one of the top tier pharmaceutical companies, continues to deploy cross-docking services to enhance efficiency levels of the distribution center based in Barcelona. Although e-Commerce and food & beverages sectors are likely to present abundant lucrative opportunities to the participants operating in the current cross docking services market, over the past few years, the pharmaceutical sector continues to implement automated and cross docking warehousing systems, particularly for medication that is stored in controlled temperatures and swift & efficient supply of stock.
The past couple of years have witnessed an exponential growth of the e-Commerce sector as online sales continue to skyrocket. As the number of e-Commerce customers continues to grow at a rapid pace, logistics companies are striving hard to fulfill the orders in the most efficient and time-efficient manner. At the back of the evolving consumer trends, the retail sector is also witnessing a considerable change due to which, last-mile delivery strategies have emerged as a critical differentiator among logistics companies.
Within the food & beverages industry, last-mile solutions centers are expected to optimize cross-docking capacities. Cross-docking services have garnered considerable traction from the food & beverages, as they streamline the transportation of perishable goods. The fast-paced adoption of automation and robotics across the e-Commerce sector has played an imperative role in boosting the prospects of the cross docking services market during the forecast period.
The COVID-19 pandemic continues to present a host of supply chain challenges across a host of industrial sectors. The food & beverages sector, along with the retail sector are expected be marred with a host of challenges put forward by the COVID-19 event. Challenges across the supply chain wherein distribution and transportation are integral components require a swift response due to which, the demand for cross-docking services is likely to witness considerable growth.
While some retailers are primarily dependent on storage short-term storage solutions, other players within the retail space are increasingly focusing on deploying the most ideal cross-docking services to minimize the impact of the COVID-19 pandemic. Imports from the Asia Pacific region, particularly China have declined in the first half of 2020 due to the outbreak of COVID-19 pandemic in Wuhan. However, the demand is expected to gain pace over the second half of 2020 when normalcy is restored.
The global cross docking services market is expected to grow at a healthy CAGR of ~6% during the forecast period. The market growth can be primarily attributed to a host of factors, including growing adoption in a host of end-use industries such as food & beverages, pharmaceutical, e-Commerce, and more, optimizing efficiency across supply chains and streamlining operations in warehouses. The cross docking services market growth will also depend on the integration of new technologies such as artificial intelligence, warehouse mapping, 5G, etc. While the COVID-19 pandemic continues to affect supply chains across a host of industries, cross-docking services are likely to gain considerable traction.
The global cross docking services market is expected to reach ~US$ 342 Bn by 2030 from ~US$ 200 Bn in 2020.
The cross docking services market is expected to register a CAGR of ~6% between 2020 and 2030.
Cross-docking services are increasingly being utilized across the flourishing e-Commerce sector across the world to minimize delivery times– a factor that is expected to provide a solid foundation for growth of the global cross docking services market during the forecast period.
Key players profiled in the report include CEVA Logistics (A CMA CGM Company), Ryder System, Inc., Schneider Electric SE, XPO Logistics, J.B. Hunt Transport Services, Kenco Group, Saddle Creek Logistics Services, Toll Holdings Limited , Deutsche Bahn Group, Kane Is Able, Inc., Delivery Lane Express, Inc., Kanban Logistics, World Distribution Services, and Cannon Hill Logistics.
The report provides in-depth segment analysis of the global cross docking services market, thereby providing valuable insights at macro as well as micro levels. Analysis of major countries which hold growth opportunities or account for significant share has also been included as part of geographic analysis of the cross docking services market.
1. Preface
1.1. Market Scope
1.2. Market Segmentation
1.3. Key Research Objectives
1.4. Research Highlights
2. Assumptions and Research Methodology
2.1. Market Taxonomy - Segment Definitions
2.2. Research Methodology
2.2.1. List of Primary and Secondary Sources
2.3. Key Assumptions for Data Modelling
3. Executive Summary: Global Cross Docking Services Market
4. Market Overview
4.1. Introduction
4.2. Global Market – Macroeconomic Factors Overview
4.2.1. World GDP Indicator – For Top Economies
4.2.2. Global ICT Spending (US$ Mn), 2013, 2019, 2023 and 2027
4.3. Market Factor Analysis
4.3.1. Porter’s Five Forces Analysis
4.3.2. PESTEL Analysis
4.3.3. Ecosystem Analysis
4.3.4. Market Dynamics (Growth Influencers)
4.3.4.1. Drivers
4.3.4.2. Restraints
4.3.4.3. Opportunities
4.3.4.4. Impact Analysis of Drivers and Restraints
4.4. Competitive Analysis Between Traditional Supply Chain Model Vs. Cross Docking Supply Chain Model
4.5. Global Cross Docking Services Market Analysis and Forecast, 2016 - 2027
4.5.1. Market Revenue Analysis (US$ Mn)
4.5.1.1. Historic Growth Trends, 2016-2018
4.5.1.2. Forecast Trends, 2019-2027
4.6. Market Opportunity Assessment – by Region (North America/ Europe/ Asia Pacific/ Middle East & Africa/ South America)
4.6.1. By Country
4.6.2. By Service Type
4.6.3. By End-user
4.7. Competitive Scenario and Trends
4.7.1. Internet Transit Service Type Market Concentration Rate
4.7.1.1. List of Emerging, Prominent and Leading Players
4.7.2. Mergers & Acquisitions, Expansions
4.8. Market Outlook
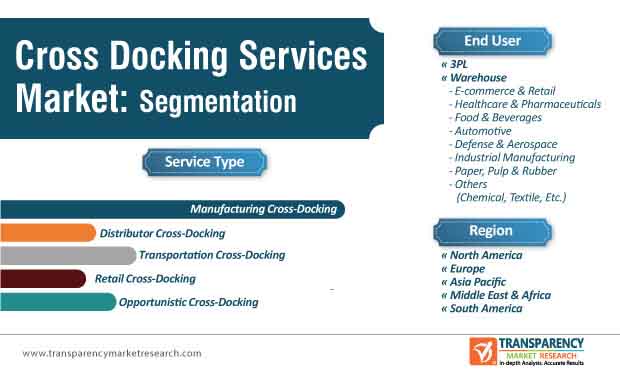
5. Global Cross Docking Services Market Analysis and Forecast, by Service Type
5.1. Overview & Definitions
5.2. Cross Docking Services Market Size (US$ Mn) Forecast, by Service Type, 2020-2030
5.2.1. Manufacturing Cross-Docking
5.2.2. Distributor Cross-Docking
5.2.3. Transportation Cross-Docking
5.2.4. Retail Cross-Docking
5.2.5. Opportunistic Cross-Docking
6. Global Cross Docking Services Market Analysis and Forecast, by End-user
6.1. Overview
6.2. Cross Docking Services Market Size (US$ Mn) Forecast, by End-user, 2020-2030
6.2.1. 3PL
6.2.2. Warehouse
6.2.2.1. E-commerce & Retail
6.2.2.2. Healthcare & Pharmaceuticals
6.2.2.3. Food & Beverages
6.2.2.4. Automotive
6.2.2.5. Defense & Aerospace
6.2.2.6. Industrial Manufacturing
6.2.2.7. Paper, Pulp & Rubber
6.2.2.8. Others (Chemical, Textile, Etc.)
7. Global Cross Docking Services Market Analysis and Forecast, by Region
7.1. Key Findings
7.2. Cross Docking Services Market Size (US$ Mn) Forecast, by Region, 2020-2030
7.2.1. North America
7.2.2. Europe
7.2.3. Asia Pacific
7.2.4. Middle East & Africa
7.2.5. South America
8. North America Cross Docking Services Market Analysis and Forecast
8.1. Regional Outlook
8.2. Key Findings
8.3. Cross Docking Services Market Size (US$ Mn) Forecast, by Service Type, 2020-2030
8.3.1. Manufacturing Cross-Docking
8.3.2. Distributor Cross-Docking
8.3.3. Transportation Cross-Docking
8.3.4. Retail Cross-Docking
8.3.5. Opportunistic Cross-Docking
8.4. Cross Docking Services Market Size (US$ Mn) Forecast, by End-user, 2020-2030
8.4.1. 3PL
8.4.2. Warehouse
8.4.2.1. E-commerce & Retail
8.4.2.2. Healthcare & Pharmaceuticals
8.4.2.3. Food & Beverages
8.4.2.4. Automotive
8.4.2.5. Defense & Aerospace
8.4.2.6. Industrial Manufacturing
8.4.2.7. Paper, Pulp & Rubber
8.4.2.8. Others (Chemical, Textile, Etc.)
8.5. Cross Docking Services Market Size (US$ Mn) Forecast, by Country & Sub-region, 2020-2030
8.5.1. U.S.
8.5.2. Canada
8.5.3. Rest of North America
9. U.S. Cross Docking Services Market Analysis and Forecast
9.1. Key Findings
9.2. Cross Docking Services Market Size (US$ Mn) Forecast, by Service Type, 2020-2030
9.2.1. Manufacturing Cross-Docking
9.2.2. Distributor Cross-Docking
9.2.3. Transportation Cross-Docking
9.2.4. Retail Cross-Docking
9.2.5. Opportunistic Cross-Docking
9.3. Cross Docking Services Market Size (US$ Mn) Forecast, by End-user, 2020-2030
9.3.1. 3PL
9.3.2. Warehouse
9.3.2.1. E-commerce & Retail
9.3.2.2. Healthcare & Pharmaceuticals
9.3.2.3. Food & Beverages
9.3.2.4. Automotive
9.3.2.5. Defense & Aerospace
9.3.2.6. Industrial Manufacturing
9.3.2.7. Paper, Pulp & Rubber
9.3.2.8. Others (Chemical, Textile, Etc.)
10. Canada Cross Docking Services Market Analysis and Forecast
10.1. Key Findings
10.2. Cross Docking Services Market Size (US$ Mn) Forecast, by Service Type, 2020-2030
10.2.1. Manufacturing Cross-Docking
10.2.2. Distributor Cross-Docking
10.2.3. Transportation Cross-Docking
10.2.4. Retail Cross-Docking
10.2.5. Opportunistic Cross-Docking
10.3. Cross Docking Services Market Size (US$ Mn) Forecast, by End-user, 2020-2030
10.3.1. 3PL
10.3.2. Warehouse
10.3.2.1. E-commerce & Retail
10.3.2.2. Healthcare & Pharmaceuticals
10.3.2.3. Food & Beverages
10.3.2.4. Automotive
10.3.2.5. Defense & Aerospace
10.3.2.6. Industrial Manufacturing
10.3.2.7. Paper, Pulp & Rubber
10.3.2.8. Others (Chemical, Textile, Etc.)
11. Europe Cross Docking Services Market Analysis and Forecast
11.1. Regional Outlook
11.2. Key Findings
11.3. Cross Docking Services Market Size (US$ Mn) Forecast, by Service Type, 2020-2030
11.3.1. Manufacturing Cross-Docking
11.3.2. Distributor Cross-Docking
11.3.3. Transportation Cross-Docking
11.3.4. Retail Cross-Docking
11.3.5. Opportunistic Cross-Docking
11.4. Cross Docking Services Market Size (US$ Mn) Forecast, by End-user, 2020-2030
11.4.1. 3PL
11.4.2. Warehouse
11.4.2.1. E-commerce & Retail
11.4.2.2. Healthcare & Pharmaceuticals
11.4.2.3. Food & Beverages
11.4.2.4. Automotive
11.4.2.5. Defense & Aerospace
11.4.2.6. Industrial Manufacturing
11.4.2.7. Paper, Pulp & Rubber
11.4.2.8. Others (Chemical, Textile, Etc.)
11.5. Cross Docking Services Market Size (US$ Mn) Forecast, by Country & Sub-region, 2020-2030
11.5.1. Germany
11.5.2. U.K.
11.5.3. France
11.5.4. Rest of Europe
12. Germany Cross Docking Services Market Analysis and Forecast
12.1. Key Findings
12.2. Cross Docking Services Market Size (US$ Mn) Forecast, by Service Type, 2020-2030
12.2.1. Manufacturing Cross-Docking
12.2.2. Distributor Cross-Docking
12.2.3. Transportation Cross-Docking
12.2.4. Retail Cross-Docking
12.2.5. Opportunistic Cross-Docking
12.3. Cross Docking Services Market Size (US$ Mn) Forecast, by End-user, 2020-2030
12.3.1. 3PL
12.3.2. Warehouse
12.3.2.1. E-commerce & Retail
12.3.2.2. Healthcare & Pharmaceuticals
12.3.2.3. Food & Beverages
12.3.2.4. Automotive
12.3.2.5. Defense & Aerospace
12.3.2.6. Industrial Manufacturing
12.3.2.7. Paper, Pulp & Rubber
12.3.2.8. Others (Chemical, Textile, Etc.)
13. U.K. Cross Docking Services Market Analysis and Forecast
13.1. Key Findings
13.2. Cross Docking Services Market Size (US$ Mn) Forecast, by Service Type, 2020-2030
13.2.1. Manufacturing Cross-Docking
13.2.2. Distributor Cross-Docking
13.2.3. Transportation Cross-Docking
13.2.4. Retail Cross-Docking
13.2.5. Opportunistic Cross-Docking
13.3. Cross Docking Services Market Size (US$ Mn) Forecast, by End-user, 2020-2030
13.3.1. 3PL
13.3.2. Warehouse
13.3.2.1. E-commerce & Retail
13.3.2.2. Healthcare & Pharmaceuticals
13.3.2.3. Food & Beverages
13.3.2.4. Automotive
13.3.2.5. Defense & Aerospace
13.3.2.6. Industrial Manufacturing
13.3.2.7. Paper, Pulp & Rubber
13.3.2.8. Others (Chemical, Textile, Etc.)
14. France Cross Docking Services Market Analysis and Forecast
14.1. Key Findings
14.2. Cross Docking Services Market Size (US$ Mn) Forecast, by Service Type, 2020-2030
14.2.1. Manufacturing Cross-Docking
14.2.2. Distributor Cross-Docking
14.2.3. Transportation Cross-Docking
14.2.4. Retail Cross-Docking
14.2.5. Opportunistic Cross-Docking
14.3. Cross Docking Services Market Size (US$ Mn) Forecast, by End-user, 2020-2030
14.3.1. 3PL
14.3.2. Warehouse
14.3.2.1. E-commerce & Retail
14.3.2.2. Healthcare & Pharmaceuticals
14.3.2.3. Food & Beverages
14.3.2.4. Automotive
14.3.2.5. Defense & Aerospace
14.3.2.6. Industrial Manufacturing
14.3.2.7. Paper, Pulp & Rubber
14.3.2.8. Others (Chemical, Textile, Etc.)
15. Asia Pacific Cross Docking Services Market Analysis and Forecast
15.1. Key Findings
15.2. Cross Docking Services Market Size (US$ Mn) Forecast, by Service Type, 2020-2030
15.2.1. Manufacturing Cross-Docking
15.2.2. Distributor Cross-Docking
15.2.3. Transportation Cross-Docking
15.2.4. Retail Cross-Docking
15.2.5. Opportunistic Cross-Docking
15.3. Cross Docking Services Market Size (US$ Mn) Forecast, by End-user, 2020-2030
15.3.1. 3PL
15.3.2. Warehouse
15.3.2.1. E-commerce & Retail
15.3.2.2. Healthcare & Pharmaceuticals
15.3.2.3. Food & Beverages
15.3.2.4. Automotive
15.3.2.5. Defense & Aerospace
15.3.2.6. Industrial Manufacturing
15.3.2.7. Paper, Pulp & Rubber
15.3.2.8. Others (Chemical, Textile, Etc.)
15.4. Cross Docking Services Market Size (US$ Mn) Forecast, by Country & Sub-region, 2020-2030
15.4.1. China
15.4.2. India
15.4.3. Japan
15.4.4. ASEAN
15.4.5. Rest of Asia Pacific
16. China Cross Docking Services Market Analysis and Forecast
16.1. Key Findings
16.2. Cross Docking Services Market Size (US$ Mn) Forecast, by Service Type, 2020-2030
16.2.1. Manufacturing Cross-Docking
16.2.2. Distributor Cross-Docking
16.2.3. Transportation Cross-Docking
16.2.4. Retail Cross-Docking
16.2.5. Opportunistic Cross-Docking
16.3. Cross Docking Services Market Size (US$ Mn) Forecast, by End-user, 2020-2030
16.3.1. 3PL
16.3.2. Warehouse
16.3.2.1. E-commerce & Retail
16.3.2.2. Healthcare & Pharmaceuticals
16.3.2.3. Food & Beverages
16.3.2.4. Automotive
16.3.2.5. Defense & Aerospace
16.3.2.6. Industrial Manufacturing
16.3.2.7. Paper, Pulp & Rubber
16.3.2.8. Others (Chemical, Textile, Etc.)
17. India Cross Docking Services Market Analysis and Forecast
17.1. Key Findings
17.2. Cross Docking Services Market Size (US$ Mn) Forecast, by Service Type, 2020-2030
17.2.1. Manufacturing Cross-Docking
17.2.2. Distributor Cross-Docking
17.2.3. Transportation Cross-Docking
17.2.4. Retail Cross-Docking
17.2.5. Opportunistic Cross-Docking
17.3. Cross Docking Services Market Size (US$ Mn) Forecast, by End-user, 2020-2030
17.3.1. 3PL
17.3.2. Warehouse
17.3.2.1. E-commerce & Retail
17.3.2.2. Healthcare & Pharmaceuticals
17.3.2.3. Food & Beverages
17.3.2.4. Automotive
17.3.2.5. Defense & Aerospace
17.3.2.6. Industrial Manufacturing
17.3.2.7. Paper, Pulp & Rubber
17.3.2.8. Others (Chemical, Textile, Etc.)
18. Japan Cross Docking Services Market Analysis and Forecast
18.1. Key Findings
18.2. Cross Docking Services Market Size (US$ Mn) Forecast, by Service Type, 2020-2030
18.2.1. Manufacturing Cross-Docking
18.2.2. Distributor Cross-Docking
18.2.3. Transportation Cross-Docking
18.2.4. Retail Cross-Docking
18.2.5. Opportunistic Cross-Docking
18.3. Cross Docking Services Market Size (US$ Mn) Forecast, by End-user, 2020-2030
18.3.1. 3PL
18.3.2. Warehouse
18.3.2.1. E-commerce & Retail
18.3.2.2. Healthcare & Pharmaceuticals
18.3.2.3. Food & Beverages
18.3.2.4. Automotive
18.3.2.5. Defense & Aerospace
18.3.2.6. Industrial Manufacturing
18.3.2.7. Paper, Pulp & Rubber
18.3.2.8. Others (Chemical, Textile, Etc.)
19. ASEAN Cross Docking Services Market Analysis and Forecast
19.1. Key Findings
19.2. Cross Docking Services Market Size (US$ Mn) Forecast, by Service Type, 2020-2030
19.2.1. Manufacturing Cross-Docking
19.2.2. Distributor Cross-Docking
19.2.3. Transportation Cross-Docking
19.2.4. Retail Cross-Docking
19.2.5. Opportunistic Cross-Docking
19.3. Cross Docking Services Market Size (US$ Mn) Forecast, by End-user, 2020-2030
19.3.1. 3PL
19.3.2. Warehouse
19.3.2.1. E-commerce & Retail
19.3.2.2. Healthcare & Pharmaceuticals
19.3.2.3. Food & Beverages
19.3.2.4. Automotive
19.3.2.5. Defense & Aerospace
19.3.2.6. Industrial Manufacturing
19.3.2.7. Paper, Pulp & Rubber
19.3.2.8. Others (Chemical, Textile, Etc.)
20. Middle East & Africa Cross Docking Services Market Analysis and Forecast
20.1. Regional Outlook
20.2. Key Findings
20.3. Cross Docking Services Market Size (US$ Mn) Forecast, by Service Type, 2020-2030
20.3.1. Manufacturing Cross-Docking
20.3.2. Distributor Cross-Docking
20.3.3. Transportation Cross-Docking
20.3.4. Retail Cross-Docking
20.3.5. Opportunistic Cross-Docking
20.4. Cross Docking Services Market Size (US$ Mn) Forecast, by End-user, 2020-2030
20.4.1. 3PL
20.4.2. Warehouse
20.4.2.1. E-commerce & Retail
20.4.2.2. Healthcare & Pharmaceuticals
20.4.2.3. Food & Beverages
20.4.2.4. Automotive
20.4.2.5. Defense & Aerospace
20.4.2.6. Industrial Manufacturing
20.4.2.7. Paper, Pulp & Rubber
20.4.2.8. Others (Chemical, Textile, Etc.)
20.5. Cross Docking Services Market Size (US$ Mn) Forecast, by Country & Sub-region, 2020-2030
20.5.1. United Arab Emirates (U.A.E.)
20.5.2. South Africa
20.5.3. Rest of MEA
21. United Arab Emirates (U.A.E.) Cross Docking Services Market Analysis and Forecast
21.1. Key Findings
21.2. Cross Docking Services Market Size (US$ Mn) Forecast, by Service Type, 2020-2030
21.2.1. Manufacturing Cross-Docking
21.2.2. Distributor Cross-Docking
21.2.3. Transportation Cross-Docking
21.2.4. Retail Cross-Docking
21.2.5. Opportunistic Cross-Docking
21.3. Cross Docking Services Market Size (US$ Mn) Forecast, by End-user, 2020-2030
21.3.1. 3PL
21.3.2. Warehouse
21.3.2.1. E-commerce & Retail
21.3.2.2. Healthcare & Pharmaceuticals
21.3.2.3. Food & Beverages
21.3.2.4. Automotive
21.3.2.5. Defense & Aerospace
21.3.2.6. Industrial Manufacturing
21.3.2.7. Paper, Pulp & Rubber
21.3.2.8. Others (Chemical, Textile, Etc.)
22. South Africa Cross Docking Services Market Analysis and Forecast
22.1. Key Findings
22.2. Cross Docking Services Market Size (US$ Mn) Forecast, by Service Type, 2020-2030
22.2.1. Manufacturing Cross-Docking
22.2.2. Distributor Cross-Docking
22.2.3. Transportation Cross-Docking
22.2.4. Retail Cross-Docking
22.2.5. Opportunistic Cross-Docking
22.3. Cross Docking Services Market Size (US$ Mn) Forecast, by End-user, 2020-2030
22.3.1. 3PL
22.3.2. Warehouse
22.3.2.1. E-commerce & Retail
22.3.2.2. Healthcare & Pharmaceuticals
22.3.2.3. Food & Beverages
22.3.2.4. Automotive
22.3.2.5. Defense & Aerospace
22.3.2.6. Industrial Manufacturing
22.3.2.7. Paper, Pulp & Rubber
22.3.2.8. Others (Chemical, Textile, Etc.)
23. South America Cross Docking Services Market Analysis and Forecast
23.1. Regional Outlook
23.2. Key Findings
23.3. Cross Docking Services Market Size (US$ Mn) Forecast, by Service Type, 2020-2030
23.3.1. Manufacturing Cross-Docking
23.3.2. Distributor Cross-Docking
23.3.3. Transportation Cross-Docking
23.3.4. Retail Cross-Docking
23.3.5. Opportunistic Cross-Docking
23.4. Cross Docking Services Market Size (US$ Mn) Forecast, by End-user, 2020-2030
23.4.1. 3PL
23.4.2. Warehouse
23.4.2.1. E-commerce & Retail
23.4.2.2. Healthcare & Pharmaceuticals
23.4.2.3. Food & Beverages
23.4.2.4. Automotive
23.4.2.5. Defense & Aerospace
23.4.2.6. Industrial Manufacturing
23.4.2.7. Paper, Pulp & Rubber
23.4.2.8. Others (Chemical, Textile, Etc.)
23.5. Cross Docking Services Market Size (US$ Mn) Forecast, by Country & Sub-region, 2020-2030
23.5.1. Brazil
23.5.2. Rest of South America
24. Brazil Cross Docking Services Market Analysis and Forecast
24.1. Key Findings
24.2. Cross Docking Services Market Size (US$ Mn) Forecast, by Service Type, 2020-2030
24.2.1. Manufacturing Cross-Docking
24.2.2. Distributor Cross-Docking
24.2.3. Transportation Cross-Docking
24.2.4. Retail Cross-Docking
24.2.5. Opportunistic Cross-Docking
24.3. Cross Docking Services Market Size (US$ Mn) Forecast, by End-user, 2020-2030
24.3.1. 3PL
24.3.2. Warehouse
24.3.2.1. E-commerce & Retail
24.3.2.2. Healthcare & Pharmaceuticals
24.3.2.3. Food & Beverages
24.3.2.4. Automotive
24.3.2.5. Defense & Aerospace
24.3.2.6. Industrial Manufacturing
24.3.2.7. Paper, Pulp & Rubber
24.3.2.8. Others (Chemical, Textile, Etc.)
25. Competition Landscape
25.1. Market Competition Matrix, by Leading Players
25.2. Market Revenue Share Analysis (%), by Leading Players (2018)
26. Company Profiles (Details – Business Overview, Geographical Presence, Key Competitors, Revenue and Strategy)
26.1. Cannon Hill Logistics
26.1.1. Business Overview
26.1.2. Geographical Presence
26.1.3. Key Competitors
26.1.4. Revenue and Strategy
26.2. CEVA Logistics
26.2.1. Business Overview
26.2.2. Geographical Presence
26.2.3. Key Competitors
26.2.4. Revenue and Strategy
26.3. DB Schenker
26.3.1. Business Overview
26.3.2. Geographical Presence
26.3.3. Key Competitors
26.3.4. Revenue and Strategy
26.4. Delivery Lane Express, Inc.
26.4.1. Business Overview
26.4.2. Geographical Presence
26.4.3. Key Competitors
26.4.4. Revenue and Strategy
26.5. Kanban Logistics
26.5.1. Business Overview
26.5.2. Geographical Presence
26.5.3. Key Competitors
26.5.4. Revenue and Strategy
26.6. Kane Is Able, Inc.
26.6.1. Business Overview
26.6.2. Geographical Presence
26.6.3. Key Competitors
26.6.4. Revenue and Strategy
26.7. Kenco Group
26.7.1. Business Overview
26.7.2. Geographical Presence
26.7.3. Key Competitors
26.7.4. Revenue and Strategy
26.8. Ryder System, Inc.
26.8.1. Business Overview
26.8.2. Geographical Presence
26.8.3. Key Competitors
26.8.4. Revenue and Strategy
26.9. Saddle Creek Logistics Services
26.9.1. Business Overview
26.9.2. Geographical Presence
26.9.3. Key Competitors
26.9.4. Revenue and Strategy
26.10. Schneider Electric SE
26.10.1. Business Overview
26.10.2. Geographical Presence
26.10.3. Key Competitors
26.10.4. Revenue and Strategy
26.11. Toll Holdings Limited
26.11.1. Business Overview
26.11.2. Geographical Presence
26.11.3. Key Competitors
26.11.4. Revenue and Strategy
26.12. World Distribution Services
26.12.1. Business Overview
26.12.2. Geographical Presence
26.12.3. Key Competitors
26.12.4. Revenue and Strategy
27. Key Takeaways
Table No.1 Acquisition/Product Launch/Partnership in Integrated Workplace Management System Market
Table No.2 Global Cross Docking Services Market Revenue (US$ Mn) Forecast, by Service Type, 2018-2030
Table No.3 Global Cross Docking Services Market Revenue (US$ Mn) Forecast, by End-user, 2018-2030
Table No.4 Global Cross Docking Services Market Revenue (US$ Mn) Forecast, by Region, 2018-2030
Table No.5 North America Cross Docking Services Market Revenue (US$ Mn) Forecast, by Service Type, 2018-2030
Table No.6 North America Cross Docking Services Market Revenue (US$ Mn) Forecast, by End-user, 2018-2030
Table No.7 North America Cross Docking Services Market Revenue (US$ Mn) Forecast, by Country, 2018-2030
Table No.9 Europe Cross Docking Services Market Revenue (US$ Mn) Forecast, by Service Type, 2018-2030
Table No.10 Europe Cross Docking Services Market Revenue (US$ Mn) Forecast, by End-user, 2018-2030
Table No.11 Europe Cross Docking Services Market Revenue (US$ Mn) Forecast, by Country, 2018-2030
Table No.12 Asia Pacific Cross Docking Services Market Revenue (US$ Mn) Forecast, by Service Type, 2018-2030
Table No.13 Asia Pacific Cross Docking Services Market Revenue (US$ Mn) Forecast, by End-user, 2018-2030
Table No.14 Asia Pacific Cross Docking Services Market Revenue (US$ Mn) Forecast, by Country, 2018-2030
Table No.15 Middle East & Africa Cross Docking Services Market Revenue (US$ Mn) Forecast, by Service Type, 2018-2030
Table No.16 Middle East & Africa Cross Docking Services Market Revenue (US$ Mn) Forecast, by End-user, 2018-2030
Table No.17 Middle East & Africa Cross Docking Services Market Revenue (US$ Mn) Forecast, by Country, 2018-2030
Table No.18 South America Cross Docking Services Market Revenue (US$ Mn) Forecast, by Service Type, 2018-2030
Table No.19 South America Cross Docking Services Market Revenue (US$ Mn) Forecast, by End-user, 2018-2030
Table No.20 South America Cross Docking Services Market Revenue (US$ Mn) Forecast, by Country, 2018-2030
Figure No. 1 Global Cross Docking Services Market Size (US$ Mn) Forecast, 2018–2030
Figure No. 2 GDP (US$ Bn), Top Countries (2014 – 2019)
Figure No. 3 Top Economies GDP Landscape, 2018
Figure No. 4 Global ICT Spending (%), by Region, 2019
Figure No. 5 Global ICT Spending (US$ Bn), Regional Contribution, 2019
Figure No. 6 Global ICT Spending (US$ Bn), Spending Type Contribution, 2019
Figure No. 7 Global ICT Spending (%), by Type, 2019
Figure No. 8 Global Cross Docking Services Market Forecast Trends (US$ Mn), 2018-2030
Figure No. 9 Global Cross Docking Services Market Y-o-Y Growth (Value %), 2018–2030
Figure No. 10 Global Cross Docking Services Market Opportunity Analysis, by Service Type (2020)
Figure No. 11 Global Cross Docking Services Market Opportunity Analysis, by End-user (2020)
Figure No. 12 Global Cross Docking Services Market Opportunity Analysis, by Region (2020)
Figure No. 13 Global Cross Docking Services Market, by Service Type, CAGR (%) (2020 – 2030)
Figure No. 14 Global Cross Docking Services Market, by End-user, CAGR (%) (2020 – 2030)
Figure No. 15 Global Cross Docking Services Market, by Region CAGR (%) (2020 – 2030)
Figure No. 16 Global Cross Docking Services Market, by Major Countries CAGR (%) (2020 – 2030)
Figure No. 17 Global Cross Docking Services Market, by Service Type, 2020
Figure No. 18 Global Cross Docking Services Market, by Service Type, 2030
Figure No. 19 Global Cross Docking Services Market, by End-user, 2020
Figure No. 20 Global Cross Docking Services Market, by End-user, 2030
Figure No. 21 Global Cross Docking Services Market, by Region, 2020
Figure No. 22 Global Cross Docking Services Market, by Region, 2030
Figure No. 23 North America Cross Docking Services Market, by Service Type, 2020
Figure No. 24 North America Cross Docking Services Market, by Service Type, 2030
Figure No. 25 North America Cross Docking Services Market, by End-user, 2020
Figure No. 26 North America Cross Docking Services Market, by End-user, 2030
Figure No. 27 North America Cross Docking Services Market, by Region, 2020
Figure No. 28 North America Cross Docking Services Market, by Region, 2030
Figure No. 29 Europe Cross Docking Services Market, by Service Type, 2020
Figure No. 30 Europe Cross Docking Services Market, by Service Type, 2030
Figure No. 31 Europe Cross Docking Services Market, by End-user, 2020
Figure No. 32 Europe Cross Docking Services Market, by End-user, 2030
Figure No. 33 Europe Cross Docking Services Market, by Region, 2020
Figure No. 34 Europe Cross Docking Services Market, by Region, 2030
Figure No. 35 Asia Pacific Cross Docking Services Market, by Service Type, 2020
Figure No. 36 Asia Pacific Cross Docking Services Market, by Service Type, 2030
Figure No. 37 Asia Pacific Cross Docking Services Market, by End-user, 2020
Figure No. 38 Asia Pacific Cross Docking Services Market, by End-user, 2030
Figure No. 39 Asia Pacific Cross Docking Services Market, by Region, 2020
Figure No. 40 Asia Pacific Cross Docking Services Market, by Region, 2030
Figure No. 41 Middle East & Africa Cross Docking Services Market, by Service Type, 2020
Figure No. 42 Middle East & Africa Cross Docking Services Market, by Service Type, 2030
Figure No. 43 Middle East & Africa Cross Docking Services Market, by End-user, 2020
Figure No. 44 Middle East & Africa Cross Docking Services Market, by End-user, 2030
Figure No. 45 Middle East & Africa Cross Docking Services Market, by Region, 2020
Figure No. 46 Middle East & Africa Cross Docking Services Market, by Region, 2030
Figure No. 47 South America Cross Docking Services Market, by Service Type, 2020
Figure No. 48 South America Cross Docking Services Market, by Service Type, 2030
Figure No. 49 South America Cross Docking Services Market, by End-user, 2020
Figure No. 50 South America Cross Docking Services Market, by End-user, 2030
Figure No. 51 South America Cross Docking Services Market, by Region, 2020
Figure No. 52 South America Cross Docking Services Market, by Region, 2030
Copyright © Transparency Market Research, Inc. All Rights reserved
Trust Online

Cross Docking Services Market
