Analysts’ Viewpoint on Global Cosmetic Skin Care Market Scenario
Companies in the global cosmetic skin care market are focusing on achieving long-term growth through effective integration and continuous improvement & innovation in cosmetic treatments. Increase in demand from Asia Pacific countries, due to rapid urbanization and rise in awareness about organic skin care products, provides lucrative opportunities for market players. Increase in trade and growth in investment avenues in developing regions are expected to provide ample opportunities to market players in the next few years. Collaboration of businesses with key players is a prominent strategy adopted by several companies to gain revenue benefits.
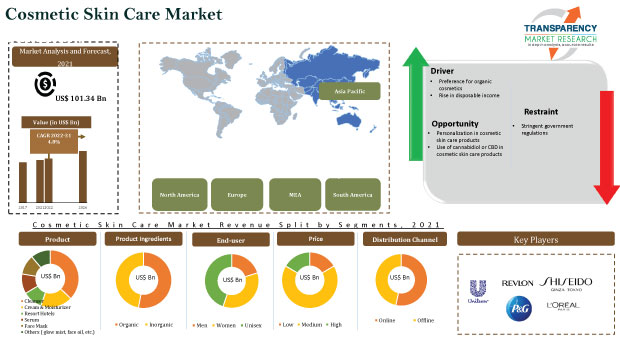
Rise in preference for organic beauty skin cosmetic products is the key factor expected to drive the global cosmetic skin care market during the forecast period. Rise in demand for organic cosmetics can be ascribed to the side-effects of chemical-based products. Key markets across the world are witnessing a rise in disposable income. Thus, increase in disposable income and rise in spending capacity on skin care cosmetics in developing countries are anticipated to drive the cosmetic skincare market in the next few years.
Organic face cosmetic skincare products are made without the use of parabens, artificial fragrances, sulfates, phthalates, synthetics, and petrochemicals. Chemical-based products tend to be harsher on the skin and may lead to side-effects. Organic cosmetic skin solutions have no such effects and are gentler on the user. Besides this, chemicals in conventional skincare products penetrate the skin and enter the bloodstream, which can lead to a range of disorders such as hormonal imbalance and cancer. Customers prefer products that are free from harmful chemicals. Demand for products that contain natural ingredients has been rising significantly across the globe.
In the beauty industry, the percentage of cosmetic personal care products that claim to have natural or organic origins stood at 3.1% in the U.S. in 2020 compared to around 2% in 2019. This is driving the U.S. skin care market size. Sale of products containing herbal oils and ingredients such as charcoal, seaberry, and sea buckthorn oil is displaying an annual growth rate of 200%. Skincare market share of products that are free from parabens, such as moisturizers, cleansers, and lip cosmetics, has been rising across product categories. It is in the range of 50%-60% of total cosmetic skin care product sales. Paraben-free lip cosmetics have reported the largest share of 87% of the total lip cosmetics sales. Preference for organic cosmetic skin care solutions is expected to have a medium impact on the market in the short term and a high impact in the long term.
Key markets across the world have seen a rise in disposable income. Increase in disposable income is linked to the rise in consumption activity. The popularity and growth of top skincare companies, whose products tend to be more expensive, are proof of the fact that people are increasing their spending on skincare solutions. L’Oreal, Unilever, Coty, Estee Lauder, and P&G were among the top brands in terms of sales value for the year 2021. Across regions, women in the 16 to 24 age bracket spend the most on cosmetic skin care products, including self-tanning products, especially in the U.K., Italy, Spain, France, and Germany. Women in Asia Pacific have an annual disposable income of about US$ 30,000. This is driving the demand for anti-aging products among women aged 30 to 40 years in the region, according to a report by Euromonitor. The working population in Asia Pacific is on the rise, with female workforce participation in Malaysia at 46.8% according to the World Bank. This leads to higher income and consequently higher disposable income among women, thus driving the cosmetic skin care market in the region.
In terms of product, the cream & moisturizer segment holds major share of the global cosmetic skin care market, as creams and moisturizers are user-friendly and convenient. Demand for creams and moisturizers, which contain natural antioxidants, is expected to rise at a significant pace as a result of a rapidly aging population. Consequently, higher number of people are expected to adopt anti-aging products with antioxidants.
Asia Pacific is likely to hold the major share of the global cosmetic skin care market during the forecast period. China, Japan, and Korea are anticipated to dominate the cosmetic skin care market in the region during the forecast period. This can be ascribed to the strong cultural and regional influences that govern the buying behavior of consumers with respect to cosmetic skin care products. India is also projected to contribute to the market growth in Asia Pacific owing to the rise in disposable income of consumers in the country. Regional influences in terms of local brands that have a better understanding of the local market are among the trends that would dictate the growth trajectory of the cosmetic skin care market in Asia Pacific.
The cosmetic skin care market is consolidated, with a few large-scale vendors controlling majority of the share. Most firms are investing significantly in comprehensive research and development activities. Expansion of product portfolios and mergers and acquisitions are the major strategies adopted by key players. The global cosmetic skin care market report includes various sections such as cosmetic skin care drivers, cosmetic skin care market analysis, challenges and opportunities in the cosmetic skin care market, and market segmentation of skin care products. Beiersdorf AG, Coty Inc., Estée Lauder Inc, Galderma Laboratories, L.P., Johnson & Johnson Consumer Inc., L’Oréal Paris, Procter & Gamble, Revlon, Shiseido Company, and Unilever are the prominent entities operating in this market.
Each of these players has been profiled in global cosmetic skin care market report based on parameters such as company overview, financial overview, business strategies, product portfolio, business segments, and recent developments.
|
Attribute |
Detail |
|
Market Size Value in 2021 |
US$ 101.34 Bn |
|
Market Forecast Value in 2031 |
US$ 154.7 Bn |
|
Growth Rate (CAGR) |
4.8% |
|
Forecast Period |
2022–2031 |
|
Historical Data Available for |
2017–2020 |
|
Quantitative Units |
US$ Bn for Value & Million Units for Volume |
|
Market Analysis |
It includes cross segment analysis at global as well as regional level. Furthermore, qualitative analysis includes drivers, restraints, opportunities, key trends, Porter’s Five Forces analysis, value chain analysis, and key trend analysis. |
|
Competition Landscape |
|
|
Format |
Electronic (PDF) + Excel |
|
Market Segmentation |
|
|
Regions Covered |
|
|
Countries Covered |
|
|
Companies Profiled |
|
|
Customization Scope |
Available upon request |
|
Pricing |
Available upon request |
The market stood at US$ 101.34 Bn in 2021
The market is estimated to grow at a CAGR of 4.8% during 2022-2031
Rise in disposable income and increase in preference for organic cosmetics are fueling the cosmetic skin care market
The offline mode accounted for around 85% share of the market in 2021
Asia Pacific is likely to be the most lucrative region of the global market in the next few years
Beiersdorf AG, Coty Inc., Estée Lauder Inc., Galderma Laboratories, L.P., Johnson & Johnson Consumer Inc., L’Oréal Paris, Procter & Gamble, Revlon, Shiseido Company, and Unilever
1. Preface
1.1. Market Definition and Scope
1.2. Market Segmentation
1.3. Key Research Objectives
1.4. Research Highlights
1.4.1. Assumptions
1.4.2. Research Methodology
1.4.3. Executive Summary
1.4.4. Market Overview
1.5. Market Dynamics
1.5.1. Drivers
1.5.2. Restraints
1.5.3. Opportunities
1.6. Key Market Indicators
1.6.1. Overall Skin Care Industry
1.7. Key Trend Analysis
1.7.1. Supplier Side
1.7.2. Demand Side
1.8. Industry SWOT Analysis
1.9. Product Ingredients Overview
1.10. Porter’s Five Forces Analysis
1.11. Value Chain Analysis
1.12. COVID-19 Impact Analysis
1.13. Global Cosmetic Skin Care Market Analysis and Forecast, 2017- 2031
1.13.1. Market Value Projections (US$ Bn)
1.13.2. Market Volume Projections (Million Units)
2. Global Cosmetic Skin Care Market Analysis and Forecast, by Product
2.1. Global Cosmetic Skin Care Market Size (US$ Bn) (Million Units), by Product, 2017- 2031
2.1.1. Cleanser
2.1.2. Cream & Moisturizer
2.1.3. Serum
2.1.4. Face Mask
2.1.5. Others (glow mist, face oil, etc.)
2.2. Incremental Opportunity, by Product
3. Global Cosmetic Skin Care Market Analysis and Forecast, by Product Ingredients
3.1. Global Cosmetic Skin Care Market Size (US$ Bn) (Million Units), by Product Ingredients, 2017- 2031
3.1.1. Organic
3.1.2. Inorganic
3.2. Incremental Opportunity, by Product Ingredients
4. Global Cosmetic Skin Care Market Analysis and Forecast, by End-user
4.1. Global Cosmetic Skin Care Market Size (US$ Bn) (Million Units), by End-user, 2017- 2031
4.1.1. Men
4.1.2. Women
4.1.3. Unisex
4.2. Incremental Opportunity, by End-user
5. Global Cosmetic Skin Care Market Analysis and Forecast, by Price
5.1. Global Cosmetic Skin Care Market Size (US$ Bn) (Million Units), by End-user, 2017- 2031
5.1.1. Low (Up to US$50)
5.1.2. Medium (US$50-US$200)
5.1.3. High (Above US$200)
5.2. Incremental Opportunity, by Price
6. Global Cosmetic Skin Care Market Analysis and Forecast, by Distribution Channel
6.1. Global Cosmetic Skin Care Market Size (US$ Bn) (Million Units), by Distribution Channel, 2017- 2031
6.1.1. Online
6.1.1.1. E-commerce Website
6.1.1.2. Company Website
6.1.2. Offline
6.1.2.1. Hypermarket/Supermarket
6.1.2.2. Speciality Stores
6.1.2.3. Other Retail Stores
6.2. Incremental Opportunity, by Distribution Channel
7. Global Cosmetic Skin Care Market Analysis and Forecast, by Region
7.1. Global Cosmetic Skin Care Market Size (US$ Bn) (Million Units), by Region, 2017- 2031
7.1.1. North America
7.1.2. Europe
7.1.3. Asia Pacific
7.1.4. Middle East & Africa
7.1.5. South America
7.2. Incremental Opportunity, by Region
8. North America Cosmetic Skin Care Market Analysis and Forecast
8.1. Regional Snapshot
8.2. Brand Analysis
8.2.1. Key Trends Analysis
8.2.2. Supply Side
8.2.3. Demand Side
8.3. Price Trend Analysis
8.3.1. Weighted Average Selling Price (US$)
8.4. Cosmetic Skin Care Market Size (US$ Bn) (Million Units), by Product, 2017- 2031
8.4.1. Cleanser
8.4.2. Cream & Moisturizer
8.4.3. Serum
8.4.4. Face Mask
8.4.5. Others (glow mist, face oil, etc.)
8.5. Cosmetic Skin Care Market Size (US$ Bn) (Million Units), by Product Ingredients, 2017- 2031
8.5.1. Organic
8.5.2. Inorganic
8.6. Cosmetic Skin Care Market Size (US$ Bn) (Million Units), by End-user, 2017- 2031
8.6.1. Men
8.6.2. Women
8.6.3. Unisex
8.7. Cosmetic Skin Care Market Size (US$ Bn) (Million Units), by Price, 2017- 2031
8.7.1. Low (Up to US$50)
8.7.2. Medium (US$50-US$200)
8.7.3. High (Above US$200)
8.8. Cosmetic Skin Care Market Size (US$ Bn) (Million Units), by Distribution Channel, 2017- 2031
8.8.1. Online
8.8.1.1. E-commerce Website
8.8.1.2. Company Website
8.8.2. Offline
8.8.2.1. Hypermarket/Supermarket
8.8.2.2. Specialty Stores
8.8.2.3. Other Retail Stores
8.9. Cosmetic Skin Care Market Size (US$ Bn) (Million Units), by Country & Sub-region, 2017- 2031
8.9.1. U.S.
8.9.2. Canada
8.9.3. Rest of North America
8.10. Incremental Opportunity Analysis
9. Europe Cosmetic Skin Care Market Analysis and Forecast
9.1. Regional Snapshot
9.2. Brand Analysis
9.3. Key Trends Analysis
9.3.1. Supply Side
9.3.2. Demand Side
9.4. Price Trend Analysis
9.4.1. Weighted Average Selling Price (US$)
9.5. Cosmetic Skin Care Market Size (US$ Bn) (Million Units), by Product, 2017- 2031
9.5.1. Cleanser
9.5.2. Cream & Moisturizer
9.5.3. Serum
9.5.4. Face Mask
9.5.5. Others (glow mist, face oil, etc.)
9.6. Cosmetic Skin Care Market Size (US$ Bn) (Million Units), by Product Ingredients, 2017- 2031
9.6.1. Organic
9.6.2. Inorganic
9.7. Cosmetic Skin Care Market Size (US$ Bn) (Million Units), by End-user, 2017- 2031
9.7.1. Men
9.7.2. Women
9.7.3. Unisex
9.8. Cosmetic Skin Care Market Size (US$ Bn) (Million Units), by Price, 2017- 2031
9.8.1. Low (Up to US$50)
9.8.2. Medium (US$50- US$200)
9.8.3. High (Above US$200)
9.9. Cosmetic Skin Care Market Size (US$ Bn) (Million Units), by Distribution Channel, 2017- 2031
9.9.1. Online
9.9.1.1. E-commerce Website
9.9.1.2. Company Website
9.9.2. Offline
9.9.2.1. Hypermarket/Supermarket
9.9.2.2. Specialty Stores
9.9.2.3. Other Retail Stores
9.10. Cosmetic Skin Care Market Size (US$ Bn) (Million Units), by Country & Sub-region, 2017- 2031
9.10.1. U.K.
9.10.2. Germany
9.10.3. France
9.10.4. Rest of Europe
9.11. Incremental Opportunity Analysis
10. Asia Pacific Cosmetic Skin Care Market Analysis and Forecast
10.1. Regional Snapshot
10.2. Brand Analysis
10.3. Key Trends Analysis
10.3.1. Supply Side
10.3.2. Demand Side
10.4. Price Trend Analysis
10.4.1. Weighted Average Selling Price (US$)
10.5. Cosmetic Skin Care Market Size (US$ Bn) (Million Units), by Product, 2017- 2031
10.5.1. Cleanser
10.5.2. Cream & Moisturizer
10.5.3. Serum
10.5.4. Face Mask
10.5.5. Others (glow mist, face oil, etc.)
10.6. Cosmetic Skin Care Market Size (US$ Bn) (Million Units), by Product Ingredients, 2017- 2031
10.6.1. Organic
10.6.2. Inorganic
10.7. Cosmetic Skin Care Market Size (US$ Bn) (Million Units), by End-user, 2017- 2031
10.7.1. Men
10.7.2. Women
10.7.3. Unisex
10.8. Cosmetic Skin Care Market Size (US$ Bn) (Million Units), by Price, 2017- 2031
10.8.1. Low (Up to US$50)
10.8.2. Medium (US$50-US$200)
10.8.3. High (Above US$200)
10.9. Cosmetic Skin Care Market Size (US$ Bn) (Million Units), by Distribution Channel, 2017- 2031
10.9.1. Online
10.9.1.1. E-commerce Website
10.9.1.2. Company Website
10.9.2. Offline
10.9.2.1. Hypermarket/Supermarket
10.9.2.2. Specialty Stores
10.9.2.3. Other Retail Stores
10.10. Cosmetic Skin Care Market Size (US$ Bn) (Million Units), by Country & Sub-region, 2017- 2031
10.10.1. China
10.10.2. India
10.10.3. Japan
10.10.4. Rest of Asia Pacific
10.11. Incremental Opportunity Analysis
11. Middle East & Africa Cosmetic Skin Care Market Analysis and Forecast
11.1. Regional Snapshot
11.2. Brand Analysis
11.3. Key Trends Analysis
11.3.1. Supply Side
11.3.2. Demand Side
11.4. Price Trend Analysis
11.4.1. Weighted Average Selling Price (US$)
11.5. Cosmetic Skin Care Market Size (US$ Bn) (Million Units), by Product, 2017- 2031
11.5.1. Cleanser
11.5.2. Cream & Moisturizer
11.5.3. Serum
11.5.4. Face Mask
11.5.5. Others (glow mist, face oil, etc.)
11.6. Cosmetic Skin Care Market Size (US$ Bn) (Million Units), by Product Ingredients, 2017- 2031
11.6.1. Organic
11.6.2. Inorganic
11.7. Cosmetic Skin Care Market Size (US$ Bn) (Million Units), by End-user, 2017- 2031
11.7.1. Men
11.7.2. Women
11.7.3. Unisex
11.8. Cosmetic Skin Care Market Size (US$ Bn) (Million Units), by Price, 2017- 2031
11.8.1. Low (Up to US$50)
11.8.2. Medium (US$50- US$200)
11.8.3. High (Above US$200)
11.9. Cosmetic Skin Care Market Size (US$ Bn) (Million Units), by Distribution Channel, 2017- 2031
11.9.1. Online
11.9.1.1. E-commerce Website
11.9.1.2. Company Website
11.9.2. Offline
11.9.2.1. Hypermarket/Supermarket
11.9.2.2. Specialty Stores
11.9.2.3. Other Retail Stores
11.10. Cosmetic Skin Care Market Size (US$ Bn) (Million Units), by Country & Sub-region, 2017- 2031
11.10.1. GCC
11.10.2. South Africa
11.10.3. Rest of Middle East & Africa
11.11. Incremental Opportunity Analysis
12. South America Cosmetic Skin Care Market Analysis and Forecast
12.1. Regional Snapshot
12.2. Brand Analysis
12.3. Key Trends Analysis
12.3.1. Supply Side
12.3.2. Demand Side
12.4. Price Trend Analysis
12.4.1. Weighted Average Selling Price (US$)
12.5. Cosmetic Skin Care Market Size (US$ Bn) (Million Units), by Product, 2017- 2031
12.5.1. Cleanser
12.5.2. Cream & Moisturizer
12.5.3. Serum
12.5.4. Face Mask
12.5.5. Others (glow mist, face oil, etc.)
12.6. Cosmetic Skin Care Market Size (US$ Bn) (Million Units), by Product Ingredients, 2017- 2031
12.6.1. Organic
12.6.2. Inorganic
12.7. Cosmetic Skin Care Market Size (US$ Bn) (Million Units), by End-user, 2017- 2031
12.7.1. Men
12.7.2. Women
12.7.3. Unisex
12.8. Cosmetic Skin Care Market Size (US$ Bn) (Million Units), by Price, 2017- 2031
12.8.1. Low (Up to US$50)
12.8.2. Medium (US$50-US$200)
12.8.3. High (Above US$200)
12.9. Cosmetic Skin Care Market Size (US$ Bn) (Million Units), by Distribution Channel, 2017- 2031
12.9.1. Online
12.9.1.1. E-commerce Website
12.9.1.2. Company Website
12.9.2. Offline
12.9.2.1. Hypermarket/Supermarket
12.9.2.2. Specialty Stores
12.9.2.3. Other Retail Stores
12.10. Cosmetic Skin Care Market Size (US$ Bn) (Million Units), by Country & Sub-region, 2017- 2031
12.10.1. Brazil
12.10.2. Rest of South America
12.11. Incremental Opportunity Analysis
13. Competition Landscape
13.1. Competition Dashboard
13.2. Market Share Analysis % (2021)
13.3. Company Profiles [Company Overview, Product Portfolio, Financial Information, (Subject to Data Availability), Business Strategies / Recent Developments]
13.3.1. Beiersdorf AG
13.3.1.1. Company Overview
13.3.1.2. Product Portfolio
13.3.1.3. Financial Information, (Subject to Data Availability)
13.3.1.4. Business Strategies / Recent Developments
13.3.2. Coty Inc.
13.3.2.1. Company Overview
13.3.2.2. Product Portfolio
13.3.2.3. Financial Information, (Subject to Data Availability)
13.3.2.4. Business Strategies / Recent Developments
13.3.3. Unilever
13.3.3.1. Company Overview
13.3.3.2. Product Portfolio
13.3.3.3. Financial Information, (Subject to Data Availability)
13.3.3.4. Business Strategies / Recent Developments
13.3.4. Shiseido Company
13.3.4.1. Company Overview
13.3.4.2. Product Portfolio
13.3.4.3. Financial Information, (Subject to Data Availability)
13.3.4.4. Business Strategies / Recent Developments
13.3.5. Revlon
13.3.5.1. Company Overview
13.3.5.2. Product Portfolio
13.3.5.3. Financial Information, (Subject to Data Availability)
13.3.5.4. Business Strategies / Recent Developments
13.3.6. Procter & Gamble
13.3.6.1. Company Overview
13.3.6.2. Product Portfolio
13.3.6.3. Financial Information, (Subject to Data Availability)
13.3.6.4. Business Strategies / Recent Developments
13.3.7. L’Oréal Paris
13.3.7.1. Company Overview
13.3.7.2. Product Portfolio
13.3.7.3. Financial Information, (Subject to Data Availability)
13.3.7.4. Business Strategies / Recent Developments
13.3.8. Johnson & Johnson Consumer Inc.
13.3.8.1. Company Overview
13.3.8.2. Product Portfolio
13.3.8.3. Financial Information, (Subject to Data Availability)
13.3.8.4. Business Strategies / Recent Developments
13.3.9. Galderma Laboratories, L.P.
13.3.9.1. Company Overview
13.3.9.2. Product Portfolio
13.3.9.3. Financial Information, (Subject to Data Availability)
13.3.9.4. Business Strategies / Recent Developments
13.3.10. Estée Lauder Inc.
13.3.10.1. Company Overview
13.3.10.2. Product Portfolio
13.3.10.3. Financial Information, (Subject to Data Availability)
13.3.10.4. Business Strategies / Recent Developments
14. Key Takeaways
14.1. Identification of Potential Market Spaces
14.1.1. Product
14.1.2. Product Ingredients
14.1.3. End-user
14.1.4. Price
14.1.5. Distribution Channel
14.1.6. Geography
14.2. Understanding the Buying Process of Customers
14.3. Prevailing Market Risks
14.4. Preferred Sales & Marketing Strategy
List of Table
Table 1: Global Cosmetic Skin Care Market By Product, Million Units 2017-2031
Table 2: Global Cosmetic Skin Care Market By Product, US$ Bn 2017-2031
Table 3: Global Cosmetic Skin Care Market By Product Ingredients, Million Units 2017-2031
Table 4: Global Cosmetic Skin Care Market By Product Ingredients, US$ Bn 2017-2031
Table 5: Global Cosmetic Skin Care Market By End-user, Million Units 2017-2031
Table 6: Global Cosmetic Skin Care Market By End-user, US$ Bn 2017-2031
Table 7: Global Cosmetic Skin Care Market By Price, Million Units 2017-2031
Table 8: Global Cosmetic Skin Care Market By Price, US$ Bn 2017-2031
Table 9: Global Cosmetic Skin Care Market By Distribution Channel, Million Units 2017-2031
Table 10: Global Cosmetic Skin Care Market By Distribution Channel, US$ Bn 2017-2031
Table 11: Global Cosmetic Skin Care Market By Region, Million Units 2017-2031
Table 12: Global Cosmetic Skin Care Market By Region, US$ Bn 2017-2031
Table 13: North America Cosmetic Skin Care Market By Product, Million Units 2017-2031
Table 14: North America Cosmetic Skin Care Market By Product, US$ Bn 2017-2031
Table 15: North America Cosmetic Skin Care Market By Product Ingredients, Million Units 2017-2031
Table 16: North America Cosmetic Skin Care Market By Product Ingredients, US$ Bn 2017-2031
Table 17: North America Cosmetic Skin Care Market By End-user, Million Units 2017-2031
Table 18: North America Cosmetic Skin Care Market By End-user, US$ Bn 2017-2031
Table 19: North America Cosmetic Skin Care Market By Price, Million Units 2017-2031
Table 20: North America Cosmetic Skin Care Market By Price, US$ Bn 2017-2031
Table 21: North America Cosmetic Skin Care Market By Distribution Channel, Million Units 2017-2031
Table 22: North America Cosmetic Skin Care Market By Distribution Channel, US$ Bn 2017-2031
Table 23: North America Cosmetic Skin Care Market By Region, Million Units 2017-2031
Table 24: North America Cosmetic Skin Care Market By Region, US$ Bn 2017-2031
Table 25: Europe Cosmetic Skin Care Market By Product, Million Units 2017-2031
Table 26: Europe Cosmetic Skin Care Market By Product, US$ Bn 2017-2031
Table 27: Europe Cosmetic Skin Care Market By Product Ingredients, Million Units 2017-2031
Table 28: Europe Cosmetic Skin Care Market By Product Ingredients, US$ Bn 2017-2031
Table 29: Europe Cosmetic Skin Care Market By End-user, Million Units 2017-2031
Table 30: Europe Cosmetic Skin Care Market By End-user, US$ Bn 2017-2031
Table 31: Europe Cosmetic Skin Care Market By Price, Million Units 2017-2031
Table 32: Europe Cosmetic Skin Care Market By Price, US$ Bn 2017-2031
Table 33: Europe Cosmetic Skin Care Market By Distribution Channel, Million Units 2017-2031
Table 34: Europe Cosmetic Skin Care Market By Distribution Channel, US$ Bn 2017-2031
Table 35: Europe Cosmetic Skin Care Market By Region, Million Units 2017-2031
Table 36: Europe Cosmetic Skin Care Market By Region, US$ Bn 2017-2031
Table 37: Asia Pacific Cosmetic Skin Care Market By Product, Million Units 2017-2031
Table 38: Asia Pacific Cosmetic Skin Care Market By Product, US$ Bn 2017-2031
Table 39: Asia Pacific Cosmetic Skin Care Market By Product Ingredients, Million Units 2017-2031
Table 40: Asia Pacific Cosmetic Skin Care Market By Product Ingredients, US$ Bn 2017-2031
Table 41: Asia Pacific Cosmetic Skin Care Market By End-user, Million Units 2017-2031
Table 42: Asia Pacific Cosmetic Skin Care Market By End-user, US$ Bn 2017-2031
Table 43: Asia Pacific Cosmetic Skin Care Market By Price, Million Units 2017-2031
Table 44: Asia Pacific Cosmetic Skin Care Market By Price, US$ Bn 2017-2031
Table 45: Asia Pacific Cosmetic Skin Care Market By Distribution Channel, Million Units 2017-2031
Table 46: Asia Pacific Cosmetic Skin Care Market By Distribution Channel, US$ Bn 2017-2031
Table 47: Asia Pacific Cosmetic Skin Care Market By Region, Million Units 2017-2031
Table 48: Asia Pacific Cosmetic Skin Care Market By Region, US$ Bn 2017-2031
Table 49: Middle East & Africa Cosmetic Skin Care Market By Product, Million Units 2017-2031
Table 50: Middle East & Africa Cosmetic Skin Care Market By Product, US$ Bn 2017-2031
Table 51: Middle East & Africa Cosmetic Skin Care Market By Product Ingredients, Million Units 2017-2031
Table 52: Middle East & Africa Cosmetic Skin Care Market By Product Ingredients, US$ Bn 2017-2031
Table 53: Middle East & Africa Cosmetic Skin Care Market By End-user, Million Units 2017-2031
Table 54: Middle East & Africa Cosmetic Skin Care Market By End-user, US$ Bn 2017-2031
Table 55: Middle East & Africa Cosmetic Skin Care Market By Price, Million Units 2017-2031
Table 56: Middle East & Africa Cosmetic Skin Care Market By Price, US$ Bn 2017-2031
Table 57: Middle East & Africa Cosmetic Skin Care Market By Distribution Channel, Million Units 2017-2031
Table 58: Middle East & Africa Cosmetic Skin Care Market By Distribution Channel, US$ Bn 2017-2031
Table 59: Middle East & Africa Cosmetic Skin Care Market By Region, Million Units 2017-2031
Table 60: Middle East & Africa Cosmetic Skin Care Market By Region, US$ Bn 2017-2031
Table 61: South America Cosmetic Skin Care Market By Product, Million Units 2017-2031
Table 62: South America Cosmetic Skin Care Market By Product, US$ Bn 2017-2031
Table 63: South America Cosmetic Skin Care Market By Product Ingredients, Million Units 2017-2031
Table 64: South America Cosmetic Skin Care Market By Product Ingredients, US$ Bn 2017-2031
Table 65: South America Cosmetic Skin Care Market By End-user, Million Units 2017-2031
Table 66: South America Cosmetic Skin Care Market By End-user, US$ Bn 2017-2031
Table 67: South America Cosmetic Skin Care Market By Price, Million Units 2017-2031
Table 68: South America Cosmetic Skin Care Market By Price, US$ Bn 2017-2031
Table 69: South America Cosmetic Skin Care Market By Distribution Channel, Million Units 2017-2031
Table 70: South America Cosmetic Skin Care Market By Distribution Channel, US$ Bn 2017-2031
Table 71: South America Cosmetic Skin Care Market By Region, Million Units 2017-2031
Table 72: South America Cosmetic Skin Care Market By Region, US$ Bn 2017-2031
List of Figures
Figure 1: Global Cosmetic Skin Care Market By Product, Million Units 2017-2031
Figure 2: Global Cosmetic Skin Care Market By Product, US$ Bn 2017-2031
Figure 3: Global Cosmetic Skin Care Market Incremental Opportunity, By Product, 2017-2031
Figure 4: Global Cosmetic Skin Care Market By Product Ingredients, Million Units 2017-2031
Figure 5: Global Cosmetic Skin Care Market By Product Ingredients, US$ Bn 2017-2031
Figure 6: Global Cosmetic Skin Care Market Incremental Opportunity, By Product Ingredients, 2017-2031
Figure 7: Global Cosmetic Skin Care Market By End-user, Million Units 2017-2031
Figure 8: Global Cosmetic Skin Care Market By End-user, US$ Bn 2017-2031
Figure 9: Global Cosmetic Skin Care Market Incremental Opportunity, By End-user, 2017-2031
Figure 10: Global Cosmetic Skin Care Market By Price, Million Units 2017-2031
Figure 11: Global Cosmetic Skin Care Market By Price, US$ Bn 2017-2031
Figure 12: Global Cosmetic Skin Care Market Incremental Opportunity, By Price, 2017-2031
Figure 13: Global Cosmetic Skin Care Market By Distribution Channel, Million Units 2017-2031
Figure 14: Global Cosmetic Skin Care Market By Distribution Channel, US$ Bn 2017-2031
Figure 15: Global Cosmetic Skin Care Market Incremental Opportunity, By Distribution Channel, 2017-2031
Figure 16: Global Cosmetic Skin Care Market By Region, Million Units 2017-2031
Figure 17: Global Cosmetic Skin Care Market By Region, US$ Bn 2017-2031
Figure 18: Global Cosmetic Skin Care Market Incremental Opportunity, By Region, 2017-2031
Figure 19: North America Cosmetic Skin Care Market By Product, Million Units 2017-2031
Figure 20: North America Cosmetic Skin Care Market By Product, US$ Bn 2017-2031
Figure 21: North America Cosmetic Skin Care Market Incremental Opportunity, By Product, 2017-2031
Figure 22: North America Cosmetic Skin Care Market By Product Ingredients, Million Units 2017-2031
Figure 23: North America Cosmetic Skin Care Market By Product Ingredients, US$ Bn 2017-2031
Figure 24: North America Cosmetic Skin Care Market Incremental Opportunity, By Product Ingredients, 2017-2031
Figure 25: North America Cosmetic Skin Care Market By End-user, Million Units 2017-2031
Figure 26: North America Cosmetic Skin Care Market By End-user, US$ Bn 2017-2031
Figure 27: North America Cosmetic Skin Care Market Incremental Opportunity, By End-user, 2017-2031
Figure 28: North America Cosmetic Skin Care Market By Price, Million Units 2017-2031
Figure 29: North America Cosmetic Skin Care Market By Price, US$ Bn 2017-2031
Figure 30: North America Cosmetic Skin Care Market Incremental Opportunity, By Price, 2017-2031
Figure 31: North America Cosmetic Skin Care Market By Distribution Channel, Million Units 2017-2031
Figure 32: North America Cosmetic Skin Care Market By Distribution Channel, US$ Bn 2017-2031
Figure 33: North America Cosmetic Skin Care Market Incremental Opportunity, By Distribution Channel, 2017-2031
Figure 34: North America Cosmetic Skin Care Market By Region, Million Units 2017-2031
Figure 35: North America Cosmetic Skin Care Market By Region, US$ Bn 2017-2031
Figure 36: North America Cosmetic Skin Care Market Incremental Opportunity, By Region, 2017-2031
Figure 37: Europe Cosmetic Skin Care Market By Product, Million Units 2017-2031
Figure 38: Europe Cosmetic Skin Care Market By Product, US$ Bn 2017-2031
Figure 39: Europe Cosmetic Skin Care Market Incremental Opportunity, By Product, 2017-2031
Figure 40: Europe Cosmetic Skin Care Market By Product Ingredients, Million Units 2017-2031
Figure 41: Europe Cosmetic Skin Care Market By Product Ingredients, US$ Bn 2017-2031
Figure 42: Europe Cosmetic Skin Care Market Incremental Opportunity, By Product Ingredients, 2017-2031
Figure 43: Europe Cosmetic Skin Care Market By End-user, Million Units 2017-2031
Figure 44: Europe Cosmetic Skin Care Market By End-user, US$ Bn 2017-2031
Figure 45: Europe Cosmetic Skin Care Market Incremental Opportunity, By End-user, 2017-2031
Figure 46: Europe Cosmetic Skin Care Market By Price, Million Units 2017-2031
Figure 47: Europe Cosmetic Skin Care Market By Price, US$ Bn 2017-2031
Figure 48: Europe Cosmetic Skin Care Market Incremental Opportunity, By Price, 2017-2031
Figure 49: Europe Cosmetic Skin Care Market By Distribution Channel, Million Units 2017-2031
Figure 50: Europe Cosmetic Skin Care Market By Distribution Channel, US$ Bn 2017-2031
Figure 51: Europe Cosmetic Skin Care Market Incremental Opportunity, By Distribution Channel, 2017-2031
Figure 52: Europe Cosmetic Skin Care Market By Region, Million Units 2017-2031
Figure 53: Europe Cosmetic Skin Care Market By Region, US$ Bn 2017-2031
Figure 54: Europe Cosmetic Skin Care Market Incremental Opportunity, By Region, 2017-2031
Figure 55: Asia Pacific Cosmetic Skin Care Market By Product, Million Units 2017-2031
Figure 56: Asia Pacific Cosmetic Skin Care Market By Product, US$ Bn 2017-2031
Figure 57: Asia Pacific Cosmetic Skin Care Market Incremental Opportunity, By Product, 2017-2031
Figure 58: Asia Pacific Cosmetic Skin Care Market By Product Ingredients, Million Units 2017-2031
Figure 59: Asia Pacific Cosmetic Skin Care Market By Product Ingredients, US$ Bn 2017-2031
Figure 60: Asia Pacific Cosmetic Skin Care Market Incremental Opportunity, By Product Ingredients, 2017-2031
Figure 61: Asia Pacific Cosmetic Skin Care Market By End-user, Million Units 2017-2031
Figure 62: Asia Pacific Cosmetic Skin Care Market By End-user, US$ Bn 2017-2031
Figure 63: Asia Pacific Cosmetic Skin Care Market Incremental Opportunity, By End-user, 2017-2031
Figure 64: Asia Pacific Cosmetic Skin Care Market By Price, Million Units 2017-2031
Figure 65: Asia Pacific Cosmetic Skin Care Market By Price, US$ Bn 2017-2031
Figure 66: Asia Pacific Cosmetic Skin Care Market Incremental Opportunity, By Price, 2017-2031
Figure 67: Asia Pacific Cosmetic Skin Care Market By Distribution Channel, Million Units 2017-2031
Figure 68: Asia Pacific Cosmetic Skin Care Market By Distribution Channel, US$ Bn 2017-2031
Figure 69: Asia Pacific Cosmetic Skin Care Market Incremental Opportunity, By Distribution Channel, 2017-2031
Figure 70: Asia Pacific Cosmetic Skin Care Market By Region, Million Units 2017-2031
Figure 71: Asia Pacific Cosmetic Skin Care Market By Region, US$ Bn 2017-2031
Figure 72: Asia Pacific Cosmetic Skin Care Market Incremental Opportunity, By Region, 2017-2031
Figure 73: Middle East & Africa Cosmetic Skin Care Market By Product, Million Units 2017-2031
Figure 74: Middle East & Africa Cosmetic Skin Care Market By Product, US$ Bn 2017-2031
Figure 75: Middle East & Africa Cosmetic Skin Care Market Incremental Opportunity, By Product, 2017-2031
Figure 76: Middle East & Africa Cosmetic Skin Care Market By Product Ingredients, Million Units 2017-2031
Figure 77: Middle East & Africa Cosmetic Skin Care Market By Product Ingredients, US$ Bn 2017-2031
Figure 78: Middle East & Africa Cosmetic Skin Care Market Incremental Opportunity, By Product Ingredients, 2017-2031
Figure 79: Middle East & Africa Cosmetic Skin Care Market By End-user, Million Units 2017-2031
Figure 80: Middle East & Africa Cosmetic Skin Care Market By End-user, US$ Bn 2017-2031
Figure 81: Middle East & Africa Cosmetic Skin Care Market Incremental Opportunity, By End-user, 2017-2031
Figure 82: Middle East & Africa Cosmetic Skin Care Market By Price, Million Units 2017-2031
Figure 83: Middle East & Africa Cosmetic Skin Care Market By Price, US$ Bn 2017-2031
Figure 84: Middle East & Africa Cosmetic Skin Care Market Incremental Opportunity, By Price, 2017-2031
Figure 85: Middle East & Africa Cosmetic Skin Care Market By Distribution Channel, Million Units 2017-2031
Figure 86: Middle East & Africa Cosmetic Skin Care Market By Distribution Channel, US$ Bn 2017-2031
Figure 87: Middle East & Africa Cosmetic Skin Care Market Incremental Opportunity, By Distribution Channel, 2017-2031
Figure 88: Middle East & Africa Cosmetic Skin Care Market By Region, Million Units 2017-2031
Figure 89: Middle East & Africa Cosmetic Skin Care Market By Region, US$ Bn 2017-2031
Figure 90: Middle East & Africa Cosmetic Skin Care Market Incremental Opportunity, By Region, 2017-2031
Figure 91: South America Cosmetic Skin Care Market By Product, Million Units 2017-2031
Figure 92: South America Cosmetic Skin Care Market By Product, US$ Bn 2017-2031
Figure 93: South America Cosmetic Skin Care Market Incremental Opportunity, By Product, 2017-2031
Figure 94: South America Cosmetic Skin Care Market By Product Ingredients, Million Units 2017-2031
Figure 95: South America Cosmetic Skin Care Market By Product Ingredients, US$ Bn 2017-2031
Figure 96: South America Cosmetic Skin Care Market Incremental Opportunity, By Product Ingredients, 2017-2031
Figure 97: South America Cosmetic Skin Care Market By End-user, Million Units 2017-2031
Figure 98: South America Cosmetic Skin Care Market By End-user, US$ Bn 2017-2031
Figure 99: South America Cosmetic Skin Care Market Incremental Opportunity, By End-user, 2017-2031
Figure 100: South America Cosmetic Skin Care Market By Price, Million Units 2017-2031
Figure 101: South America Cosmetic Skin Care Market By Price, US$ Bn 2017-2031
Figure 102: South America Cosmetic Skin Care Market Incremental Opportunity, By Price, 2017-2031
Figure 103: South America Cosmetic Skin Care Market By Distribution Channel, Million Units 2017-2031
Figure 104: South America Cosmetic Skin Care Market By Distribution Channel, US$ Bn 2017-2031
Figure 105: South America Cosmetic Skin Care Market Incremental Opportunity, By Distribution Channel, 2017-2031
Figure 106: South America Cosmetic Skin Care Market By Region, Million Units 2017-2031
Figure 107: South America Cosmetic Skin Care Market By Region, US$ Bn 2017-2031
Figure 108: South America Cosmetic Skin Care Market Incremental Opportunity, By Region, 2017-2031
Copyright © Transparency Market Research, Inc. All Rights reserved
Trust Online

Cosmetic Skin Care Market
