Stimulant medications are increasingly gaining credibility for being a safe and effective option for ADHD (Attention Deficit Hyperactivity Disorder) treatment as far as children are concerned. Improved formulations of stimulants have benefitted children in letting them focus their thoughts better and ignore distractions. Companies in the controlled substance market are teaming up with doctors and healthcare providers to combine the treatment of stimulant medications with behavior therapy to treat children suffering from ADHD. This developmental aspect has helped children pay more attention to routine activities and control their behavior.
The application of stimulants in the treatment of ADHD is estimated to increase in the coming years. ADHD accounts for the second-highest revenue amongst all applications in the controlled substance market, with a projected value of ~US$ 25 billion by the end of 2027. Due to these favorable aspects, it has been found that, the right medication of stimulants amongst ADHD patients has shown positive improvements in their behavioral patterns. Two forms of stimulants, namely, immediate release (short-acting) medications and extended release (immediate-acting and long-acting) medications are lately being talked about in the controlled substance market. The former is gaining increased popularity, since the medication is less expensive as compared to other stimulant drugs.
Stimulant drugs are even proving useful for patients with Tourette syndrome. Medications such as atomoxetine or guanfacine are safe and recommended for children to reduce conditions associated with frequent tics and unusual vocal sounds.
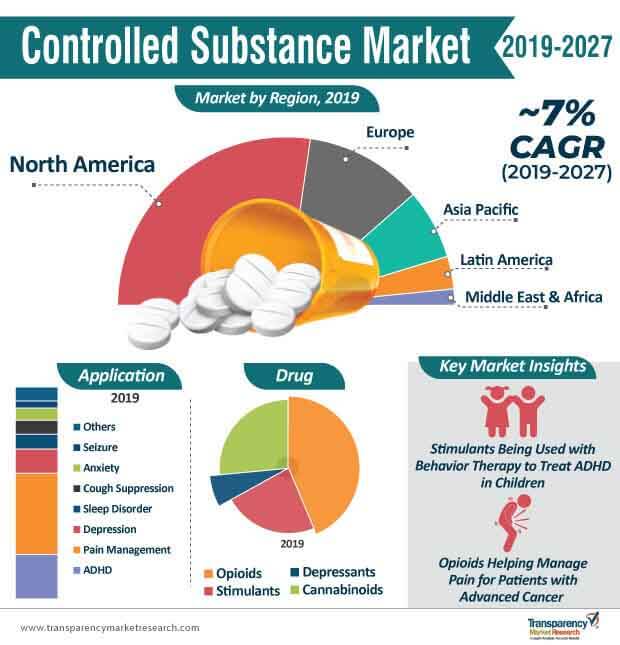
Pain management is a necessary aspect for patients associated with advanced cancer. Thus, opioids are highly recommended for cancer patients to reduce the discomfort caused due to a diverse group of pain syndromes. Pain management is estimated to account for the highest revenue amongst all applications in the controlled substance market, with an estimated value of ~US$ 43 billion by the end of 2027. Thus, the increased prescription of opioid for advanced cancer patients is one of the major reasons for the exponential growth of pain management in the controlled substance market.
Although opioids help reduce the severity of pain syndromes, certain drawbacks of the medication are leading to resistance in its adoption amongst advanced cancer patients. Cognitive impairment and delirium are some of the few side effects caused due to the consumption of opioids. To overcome these drawbacks, healthcare companies in the controlled substance market are increasing awareness about screening in the early stages of delirium. Mini Mental State Examination and the Memorial Delirium-Assessment Scale are some of the credible tools that aid the screening procedure to assess the severity of cognitive impairment and delirium in patients.
In order to encourage advanced cancer patients to adopt opioids, companies in the controlled substance market are educating doctors and healthcare providers to thoroughly examine the complex and multi-faceted nature of pain management amongst patients.
The controlled substance market is projected to grow at a healthy CAGR of ~7% during the forecast period. However, on the other hand, the limitations and adverse effects of certain drugs may hamper the growth of the controlled substance market. For instance, tramadol is an effective drug for pain relief, but confounding reasons of patients have led to instances of increased morbidity and mortality.
Tramadol has the potential for abuse and addiction. Although tramadol is being utilized and accepted in medical care, it is tightly regulated. Confounding reasons present ambiguity for the effectiveness of tramadol. Although tramadol is classified as a Schedule IV drug, lack of appropriate prescription for the drug has caused high rates of death in the controlled substance landscape. To overcome these challenges, manufacturers in the controlled substance market are increasing awareness about the judicious prescription of tramadol. They are increasing research & development to help educate doctors and patients about the potential risks of tramadol treatment.
In order to make medical research studies more authentic, companies in the controlled substance market should assess confounders to enhance the credibility of research outcomes. Healthcare companies are increasing the availability of tramadol amongst patients suffering from osteoarthritis and other painful conditions.
Analysts’ Viewpoint
Opioids are efficacious pain-reducing medications. However, strict laws and regulations dictate the prescription of opioids, since these medications are found to cause serious harm to patients, owing to their side effects. As such, healthcare companies need to work in collaboration with health commissions such as the FDA to improve enforcement on the illicit marketing of unapproved opioids, and offer access to improved treatment alternatives for patients suffering from acute and chronic pain.
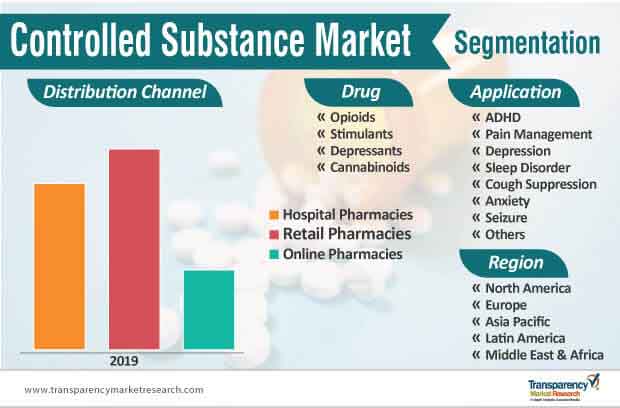
Manufacturers should strengthen their distribution networks through retail and online pharmacies, as these two sectors are projected for high growth in the controlled substance market. Likewise, there is scope for increased market growth in Europe and Asia Pacific, owing to improvements in the healthcare infrastructure in both these regions.
Global Controlled Substance Market: Description
Controlled Substance Market: Drivers
Global Controlled Substance Market: Prominent Segments
Global Controlled Substance Market: Competition Landscape
Controlled substance Market to reach a value of ~US$ 115 Bn by 2027
Controlled substance Market is expected to expand at a CAGR of ~7% during the forecast period of 2019 to 2027
Controlled substance Market is driven by high incidence rate of chronic pain among the geriatric population across the globe
North America accounted for a major share of the global controlled substance market
Key players in the global controlled substance market include F. Hoffmann-La Roche AG, AbbVie, Inc., Mallinckrodt plc, Pfizer, Inc., Sun Pharmaceuticals Ltd
1. Preface
1.1. Market Definition and Scope
1.2. Market Segmentation
1.3. Key Research Objectives
1.4. Research Highlights
2. Assumptions and Research Methodology
3. Executive Summary : Global Controlled Substance Market
4. Market Overview
4.1. Introduction
4.1.1. Class Definition
4.1.2. Industry Evolution / Developments
4.2. Overview
4.3. Market Dynamics
4.3.1. Drivers
4.3.2. Restraints
4.3.3. Opportunities
4.4. Global Controlled Substance Market Analysis and Forecasts, 2017–2027
4.4.1. Market Revenue Projections (US$ Mn)
5. Market Outlook
5.1. Pipeline Analysis
5.2. Key Merger & Acquisition
5.3. Regulatory Scenario
6. Global Controlled Substance Market Analysis and Forecasts, by Drug, 2017-2027
6.1. Introduction & Definition
6.2. Key Findings / Developments
6.3. Market Value Forecast, by Drug, 2017–2027
6.3.1. Opioids
6.3.1.1. Codeine
6.3.1.2. Morphine
6.3.1.3. Fentanyl
6.3.1.4. Hydrocodone
6.3.1.5. Tramadol
6.3.1.6. Oxycodone
6.3.1.7. Others
6.3.2. Stimulants
6.3.2.1. Amphetamine
6.3.2.2. Methylphenidate
6.3.2.3. Dextroamphetamine
6.3.2.4. Methamphetamine
6.3.2.5. Modafinil
6.3.2.6. Others
6.3.3. Depressants
6.3.3.1. Barbiturates
6.3.3.2. Benzodiazepines
6.3.4. Cannabinoids
6.4. Market Attractiveness, by Drug
7. Global Controlled Substance Market Analysis and Forecasts, by Application, 2017-2027
7.1. Introduction & Definition
7.2. Key Findings / Developments
7.3. Market Value Forecast, by Application, 2017–2027
7.3.1. ADHD
7.3.2. Pain Management
7.3.3. Depression
7.3.4. Sleep Disorder
7.3.5. Cough Suppression
7.3.6. Anxiety
7.3.7. Seizure
7.3.8. Others
7.4. Market Attractiveness, by Application
8. Global Controlled Substance Market Analysis and Forecasts, by Distribution Channel
8.1. Introduction & Definition
8.2. Key Findings / Developments
8.3. Market Value Forecast, by Distribution Channel, 2017–2027
8.3.1. Hospital Pharmacies
8.3.2. Retail Pharmacies
8.3.3. Online Pharmacies
8.4. Market Attractiveness, by Application
9. Global Controlled Substance Market Analysis and Forecasts, by Region, 2017-2027
9.1. Key Findings
9.2. Market Value Forecast, by Region
9.2.1. North America
9.2.2. Europe
9.2.3. Asia Pacific
9.2.4. Latin America
9.2.5. Middle East & Africa
9.3. Market Attractiveness, by Region
10. North America Controlled Substance Market Analysis and Forecast, 2017-2027
10.1. Introduction
10.1.1. Key Findings
10.2. Market Value Forecast, by Drug, 2017–2027
10.2.1. Opioids
10.2.1.1. Codeine
10.2.1.2. Morphine
10.2.1.3. Fentanyl
10.2.1.4. Hydrocodone
10.2.1.5. Tramadol
10.2.1.6. Oxycodone
10.2.1.7. Others
10.2.2. Stimulants
10.2.2.1. Amphetamine
10.2.2.2. Methylphenidate
10.2.2.3. Dextroamphetamine
10.2.2.4. Methamphetamine
10.2.2.5. Modafinil
10.2.2.6. Others
10.2.3. Depressants
10.2.3.1. Barbiturates
10.2.3.2. Benzodiazepines
10.2.4. Cannabinoids
10.3. Market Value Forecast, by Application, 2017-2027
10.3.1. ADHD
10.3.2. Pain Management
10.3.3. Depression
10.3.4. Sleep Disorder
10.3.5. Cough Suppression
10.3.6. Anxiety
10.3.7. Seizure
10.3.8. Others
10.4. Market Value Forecast, by Distribution Channel, 2017-2027
10.4.1. Hospital Pharmacies
10.4.2. Retail Pharmacies
10.4.3. Online Pharmacies
10.5. Market Value Forecast, by Country, 2017-2027
10.5.1. U.S.
10.5.2. Canada
10.6. Market Attractiveness Analysis
10.6.1. By Drug
10.6.2. By Application
10.6.3. By Distribution Channel
10.6.4. By Country
11. Europe Controlled Substance Market Analysis and Forecast, 2017-2027
11.1. Introduction
11.1.1. Key Finding
11.2. Market Value Forecast, by Drug, 2017-2027
11.2.1. Opioids
11.2.1.1. Codeine
11.2.1.2. Morphine
11.2.1.3. Fentanyl
11.2.1.4. Hydrocodone
11.2.1.5. Tramadol
11.2.1.6. Oxycodone
11.2.1.7. Others
11.2.2. Stimulants
11.2.2.1. Amphetamine
11.2.2.2. Methylphenidate
11.2.2.3. Dextroamphetamine
11.2.2.4. Methamphetamine
11.2.2.5. Modafinil
11.2.2.6. Others
11.2.3. Depressants
11.2.3.1. Barbiturates
11.2.3.2. Benzodiazepines
11.2.4. Cannabinoids
11.3. Market Value Forecast, by Application, 2017-2027
11.3.1. ADHD
11.3.2. Pain Management
11.3.3. Depression
11.3.4. Sleep Disorder
11.3.5. Cough Suppression
11.3.6. Anxiety
11.3.7. Seizure
11.3.8. Others
11.4. Market Value Forecast, by Distribution Channel, 2017-2027
11.4.1. Hospital Pharmacies
11.4.2. Retail Pharmacies
11.4.3. Online Pharmacies
11.5. Market Value Forecast, by Country/Sub-region, 2017-2027
11.5.1. Germany
11.5.2. U.K.
11.5.3. France
11.5.4. Italy
11.5.5. Spain
11.5.6. Rest of Europe
11.6. Market Attractiveness Analysis
11.6.1. By Drug
11.6.2. By Application
11.6.3. By Distribution Channel
11.6.4. By Country/Sub-region
12. Asia Pacific Controlled Substance Market Analysis and Forecast, 2017-2027
12.1. Introduction
12.1.1. Key Finding
12.2. Market Value Forecast, by Drug, 2017-2027
12.2.1. Opioids
12.2.1.1. Codeine
12.2.1.2. Morphine
12.2.1.3. Fentanyl
12.2.1.4. Hydrocodone
12.2.1.5. Tramadol
12.2.1.6. Oxycodone
12.2.1.7. Others
12.2.2. Stimulants
12.2.2.1. Amphetamine
12.2.2.2. Methylphenidate
12.2.2.3. Dextroamphetamine
12.2.2.4. Methamphetamine
12.2.2.5. Modafinil
12.2.2.6. Others
12.2.3. Depressants
12.2.3.1. Barbiturates
12.2.3.2. Benzodiazepines
12.2.4. Cannabinoids
12.3. Market Value Forecast, by Application, 2017-2027
12.3.1. ADHD
12.3.2. Pain Management
12.3.3. Depression
12.3.4. Sleep Disorder
12.3.5. Cough Suppression
12.3.6. Anxiety
12.3.7. Seizure
12.3.8. Others
12.4. Market Value Forecast, by Distribution Channel, 2017-2027
12.4.1. Hospital Pharmacies
12.4.2. Retail Pharmacies
12.4.3. Online Pharmacies
12.5. Market Value Forecast, by Country/Sub-region, 2017-2027
12.5.1. China
12.5.2. Japan
12.5.3. India
12.5.4. Australia & New Zealand
12.5.5. Rest of Asia Pacific
12.6. Market Attractiveness Analysis
12.6.1. By Drug
12.6.2. By Application
12.6.3. By Distribution Channel
12.6.4. By Country/Sub-region
13. Latin America Controlled Substance Market Analysis and Forecast, 2017-2027
13.1. Introduction
13.1.1. Key Finding
13.2. Market Value Forecast, by Drug, 2017-2027
13.2.1. Opioids
13.2.1.1. Codeine
13.2.1.2. Morphine
13.2.1.3. Fentanyl
13.2.1.4. Hydrocodone
13.2.1.5. Tramadol
13.2.1.6. Oxycodone
13.2.1.7. Others
13.2.2. Stimulants
13.2.2.1. Amphetamine
13.2.2.2. Methylphenidate
13.2.2.3. Dextroamphetamine
13.2.2.4. Methamphetamine
13.2.2.5. Modafinil
13.2.2.6. Others
13.2.3. Depressants
13.2.3.1. Barbiturates
13.2.3.2. Benzodiazepines
13.2.4. Cannabinoids
13.3. Market Value Forecast, by Application, 2017-2027
13.3.1. ADHD
13.3.2. Pain Management
13.3.3. Depression
13.3.4. Sleep Disorder
13.3.5. Cough Suppression
13.3.6. Anxiety
13.3.7. Seizure
13.3.8. Others
13.4. Market Value Forecast, by Distribution Channel, 2017-2027
13.4.1. Hospital Pharmacies
13.4.2. Retail Pharmacies
13.4.3. Online Pharmacies
13.5. Market Value Forecast by Country/Sub-region, 2017-2027
13.5.1. Brazil
13.5.2. Mexico
13.5.3. Rest of Latin America
13.6. Market Attractiveness Analysis
13.6.1. By Drug
13.6.2. By Application
13.6.3. By Distribution Channel
13.6.4. By Country/Sub-region
14. Middle East & Africa Controlled Substance Market Analysis and Forecast, 2017-2027
14.1. Introduction
14.1.1. Key Finding
14.2. Market Value Forecast, by Drug, 2017-2027
14.2.1. Opioids
14.2.1.1. Codeine
14.2.1.2. Morphine
14.2.1.3. Fentanyl
14.2.1.4. Hydrocodone
14.2.1.5. Tramadol
14.2.1.6. Oxycodone
14.2.1.7. Others
14.2.2. Stimulants
14.2.2.1. Amphetamine
14.2.2.2. Methylphenidate
14.2.2.3. Dextroamphetamine
14.2.2.4. Methamphetamine
14.2.2.5. Modafinil
14.2.2.6. Others
14.2.3. Depressants
14.2.3.1. Barbiturates
14.2.3.2. Benzodiazepines
14.2.4. Cannabinoids
14.3. Market Value Forecast, by Application, 2017-2027
14.3.1. ADHD
14.3.2. Pain Management
14.3.3. Depression
14.3.4. Sleep Disorder
14.3.5. Cough Suppression
14.3.6. Anxiety
14.3.7. Seizure
14.3.8. Others
14.4. Market Value Forecast, by Distribution Channel, 2017-2027
14.4.1. Hospital Pharmacies
14.4.2. Retail Pharmacies
14.4.3. Online Pharmacies
14.5. Market Value Forecast, by Country/Sub-region, 2017-2027
14.5.1. GCC Countries
14.5.2. South Africa
14.5.3. Rest of Middle East & Africa
14.6. Market Attractiveness Analysis
14.6.1. By Drug
14.6.2. By Application
14.6.3. By Distribution Channel
14.6.4. By Country/Sub-region
15. Competition Landscape
15.1. Market Player – Competition Matrix (By Tier and Size of companies)
15.2. Market Position/Ranking Analysis by Company (2018)
15.3. Company Profiles
15.3.1. F. Hoffmann-La Roche AG
15.3.1.1. Company Overview (HQ, Business Segments, Employee Strength)
15.3.1.2. Company Financials
15.3.1.3. Growth Strategies
15.3.1.4. SWOT Analysis
15.3.2. AbbVie, Inc.
15.3.2.1. Company Overview (HQ, Business Segments, Employee Strength)
15.3.2.2. Company Financials
15.3.2.3. Growth Strategies
15.3.2.4. SWOT Analysis
15.3.3. Mallinckrodt plc
15.3.3.1. Company Overview (HQ, Business Segments, Employee Strength)
15.3.3.2. Company Financials
15.3.3.3. Growth Strategies
15.3.3.4. SWOT Analysis
15.3.4. Pfizer, Inc.
15.3.4.1. Company Overview (HQ, Business Segments, Employee Strength)
15.3.4.2. Company Financials
15.3.4.3. Growth Strategies
15.3.4.4. SWOT Analysis
15.3.5. Sun Pharmaceutical Ltd.
15.3.5.1. Company Overview (HQ, Business Segments, Employee Strength)
15.3.5.2. Company Financials
15.3.5.3. Growth Strategies
15.3.5.4. SWOT Analysis
15.3.6. Ampac Fine Chemicals
15.3.6.1. Company Overview (HQ, Business Segments, Employee Strength)
15.3.6.2. Company Financials
15.3.6.3. Growth Strategies
15.3.6.4. SWOT Analysis
15.3.7. GW Pharmaceuticals plc
15.3.7.1. Company Overview (HQ, Business Segments, Employee Strength)
15.3.7.2. Company Financials
15.3.7.3. Growth Strategies
15.3.7.4. SWOT Analysis
15.3.8. Merck & Co., Inc.
15.3.8.1. Company Overview (HQ, Business Segments, Employee Strength)
15.3.8.2. Company Financials
15.3.8.3. Growth Strategies
16.3.8.4. SWOT Analysis
List of Tables
Table 01: Global Controlled Substance Market Value (US$ Mn) Forecast, by Drug, 2017–2027
Table 02: Global Controlled Substance Market Value (US$ Mn) Forecast, by Drug (Opioids), 2017–2027
Table 03: Global Controlled Substance Market Value (US$ Mn) Forecast, by Drug (Stimulants), 2017–2027
Table 04: Global Controlled Substance Market Value (US$ Mn) Forecast, by Drug (Depressants), 2017–2027
Table 05: Global Controlled Substance Market Value (US$ Mn) Forecast, by Application, 2017–2027
Table 06: Global Controlled Substance Market Value (US$ Mn) Forecast, by Distribution Channel, 2017–2027
Table 07: Global Controlled Substance Market Value (US$ Mn) Forecast, by Region, 2017–2027
Table 08: North America Controlled Substance Market Value (US$ Mn) Forecast, by Country, 2017–2027
Table 09: North America Controlled Substance Market Value (US$ Mn) Forecast, by Drug, 2017–2027
Table 10: North America Controlled Substance Market Value (US$ Mn) Forecast, by Drug (Opioids), 2017–2027
Table 11: North America Controlled Substance Market Value (US$ Mn) Forecast, by Drug (Stimulants), 2017–2027
Table 12: North America Controlled Substance Market Value (US$ Mn) Forecast, by Drug (Depressants), 2017–2027
Table 13: North America Controlled Substance Market Value (US$ Mn) Forecast, by Application, 2017–2027
Table 14: North America Controlled Substance Market Value (US$ Mn) Forecast, by Distribution Channel, 2017–2027
Table 15: Europe Controlled Substance Market Value (US$ Mn) Forecast, by Country/Sub-region, 2017–2027
Table 16: Europe Controlled Substance Market Value (US$ Mn) Forecast, by Drug, 2017–2027
Table 17: Europe Controlled Substance Market Value (US$ Mn) Forecast, by Drug (Opioids), 2017–2027
Table 18: Europe Controlled Substance Market Value (US$ Mn) Forecast, by Drug (Stimulants), 2017–2027
Table 19: Europe Controlled Substance Market Value (US$ Mn) Forecast, by Drug (Depressants), 2017–2027
Table 20: Europe Controlled Substance Market Value (US$ Mn) Forecast, by Application, 2017–2027
Table 21: Europe Controlled Substance Market Value (US$ Mn) Forecast, by Distribution Channel, 2017–2027
Table 22: Asia Pacific Controlled Substance Market Value (US$ Mn) Forecast, by Country/Sub-region, 2017–2027
Table 23: Asia Pacific Controlled Substance Market Value (US$ Mn) Forecast, by Drug, 2017–2027
Table 24: Asia Pacific Controlled Substance Market Value (US$ Mn) Forecast, by Drug (Opioids), 2017–2027
Table 25: Asia Pacific Controlled Substance Market Value (US$ Mn) Forecast, by Drug (Stimulants), 2017–2027
Table 26: Asia Pacific Controlled Substance Market Value (US$ Mn) Forecast, by Drug (Depressants), 2017–2027
Table 27: Asia Pacific Controlled Substance Market Value (US$ Mn) Forecast, by Application, 2017–2027
Table 28: Asia Pacific Controlled Substance Market Value (US$ Mn) Forecast, by Distribution Channel, 2017–2027
Table 29: Latin America Controlled Substance Market Value (US$ Mn) Forecast, by Country/Sub-region, 2017–2027
Table 30: Latin America Controlled Substance Market Value (US$ Mn) Forecast, by Drug, 2017–2027
Table 31: Latin America Controlled Substance Market Value (US$ Mn) Forecast, by Drug (Opioids), 2017–2027
Table 32: Latin America Controlled Substance Market Value (US$ Mn) Forecast, by Drug (Stimulants), 2017–2027
Table 33: Latin America Controlled Substance Market Value (US$ Mn) Forecast, by Drug (Depressants), 2017–2027
Table 34: Latin America Controlled Substance Market Value (US$ Mn) Forecast, by Application, 2017–2027
Table 35: Latin America Controlled Substance Market Value (US$ Mn) Forecast, by Distribution Channel, 2017–2027
Table 36: Middle East & Africa Controlled Substance Market Value (US$ Mn) Forecast, by Country/Sub-region, 2017–2027
Table 37: Middle East & Africa Controlled Substance Market Value (US$ Mn) Forecast, by Drug, 2017–2027
Table 38: Middle East & Africa Controlled Substance Market Value (US$ Mn) Forecast, by Drug (Opioids), 2017–2027
Table 39: Middle East & Africa Controlled Substance Market Value (US$ Mn) Forecast, by Drug (Stimulants), 2017–2027
Table 40: Middle East & Africa Controlled Substance Market Value (US$ Mn) Forecast, by Drug (Depressants), 2017–2027
Table 41: Middle East & Africa Controlled Substance Market Value (US$ Mn) Forecast, by Application, 2017–2027
Table 42: Middle East & Africa Controlled Substance Market Value (US$ Mn) Forecast, by Distribution Channel, 2017–2027
List of Figures
Figure 01: Global Controlled Substance Market Value (US$ Mn) and Distribution, by Region, 2018 and 2027
Figure 02: Market Opportunity Map, by Drug Type, 2018
Figure 03: Global Controlled Substance Market Value (US$ Mn) Forecast, 2017–2027
Figure 04: Global Controlled Substance Market Value Share, by Drug (2018)
Figure 05: Global Controlled Substance Market Value Share, by Application (2018)
Figure 06: Global Controlled Substance Market Value Share, by Distribution Channels (2018)
Figure 07: Global Controlled Substance Market Value Share, by Region (2018)
Figure 08: Global Controlled Substance Market Value Share Analysis, by Drug, 2018 and 2027
Figure 09: Global Controlled Substance Market Revenue (US$ Mn) by Opioids, 2017-2027
Figure 10: Global Controlled Substance Market Revenue (US$ Mn) by Stimulants, 2017-2027
Figure 11: Global Controlled Substance Market Revenue (US$ Mn) by Depressants, 2017-2027
Figure 12: Global Controlled Substance Market Revenue (US$ Mn) by Cannabinoids, 2017-2027
Figure 13: Global Controlled Substance Market Attractiveness Analysis, by Drug, 2019–2027
Figure 14: Global Controlled Substance Market Value Share Analysis, by Application, 2018 and 2027
Figure 15: Global Controlled Substance Market Value (US$ Mn), by ADHD, 2017–2027
Figure 16: Global Controlled Substance Market Value (US$ Mn), by Pain Management, 2017–2027
Figure 17: Global Controlled Substance Market Value (US$ Mn), by Depression, 2017–2027
Figure 18: Global Controlled Substance Market Value (US$ Mn), by Sleep Disorder, 2017–2027
Figure 19: Global Controlled Substance Market Value (US$ Mn), by Cough Suppression, 2017–2027
Figure 20: Global Controlled Substance Market Value (US$ Mn), by Anxiety, 2017–2027
Figure 21: Global Controlled Substance Market Value (US$ Mn), by Seizure, 2017–2027
Figure 22: Global Controlled Substance Market Value (US$ Mn), by Others, 2017–2027
Figure 23: Global Controlled Substance Market Attractiveness, by Application, 2019–2027
Figure 24: Global Controlled Substance Market Value Share Analysis, by Distribution Channel, 2018 and 2027
Figure 25: Global Controlled Substance Market Revenue (US$ Mn) by Hospital Pharmacies, 2017-2027
Figure 26: Global Controlled Substance Market Revenue (US$ Mn) Retail Pharmacies, 2017-2027
Figure 27: Global Controlled Substance Market Revenue (US$ Mn) Online Pharmacies, 2017-2027
Figure 28: Global Controlled Substance Market Attractiveness Analysis, by Distribution Channel, 2019–2027
Figure 29: Global Controlled Substance Market Value Share Analysis, by Region, 2018 and 2027
Figure 30: Global Controlled Substance Market Attractiveness Analysis, by Region, 2019–2027
Figure 31: North America Controlled Substance Market Value (US$ Mn) Forecast and Y-o-Y Growth Projection (%), 2017–2027
Figure 32: North America Controlled Substance Market Value Share, by Country, 2018 and 2027
Figure 33: North America Controlled Substance Market Attractiveness, by Country, 2019–2027
Figure 34: North America Controlled Substance Market Value Share, by Drug, 2018 and 2027
Figure 35: North America Controlled Substance Market Attractiveness, by Drug, 2019–2027
Figure 36: North America Controlled Substance Market Value Share, by Application, 2018 and 2027
Figure 37: North America Controlled Substance Market Attractiveness, by Application, 2019–2027
Figure 38: North America Controlled Substance Market Value Share, by Distribution Channel, 2018 and 2027
Figure 39: North America Controlled Substance Market Attractiveness, by Distribution Channel, 2019–2027
Figure 40: Europe Controlled Substance Market Value (US$ Mn) Forecast and Y-o-Y Growth Projection (%), 2017–2027
Figure 41: Europe Controlled Substance Market Value Share, by Country/Sub-region, 2018 and 2027
Figure 42: Europe Controlled Substance Market Attractiveness, by Country/Sub-region, 2019–2027
Figure 43: Europe Controlled Substance Market Value Share, by Drug, 2018 and 2027
Figure 44: Europe Controlled Substance Market Attractiveness, by Drug, 2019–2027
Figure 45: Europe Controlled Substance Market Value Share, by Application, 2018 and 2027
Figure 46: Europe Controlled Substance Market Attractiveness, by Application, 2019–2027
Figure 47: Europe Controlled Substance Market Value Share, by Distribution Channel, 2018 and 2027
Figure 48: Europe Controlled Substance Market Attractiveness, by Distribution Channel, 2019–2027
Figure 49: Asia Pacific Controlled Substance Market Value (US$ Mn) Forecast and Y-o-Y Growth Projection (%), 2017–2027
Figure 50: Asia Pacific Controlled Substance Market Value Share, by Country/Sub-region, 2018 and 2027
Figure 51: Asia Pacific Controlled Substance Market Attractiveness, by Country/Sub-region, 2019–2027
Figure 52: Asia Pacific Controlled Substance Market Value Share, by Drug, 2018 and 2027
Figure 53: Asia Pacific Controlled Substance Market Attractiveness, by Drug, 2019–2027
Figure 54: Asia Pacific Controlled Substance Market Value Share, by Application, 2018 and 2027
Figure 55: Asia Pacific Controlled Substance Market Attractiveness, by Application, 2019–2027
Figure 56: Asia Pacific Controlled Substance Market Value Share, by Distribution Channel, 2018 and 2027
Figure 57: Asia Pacific Controlled Substance Market Attractiveness, by Distribution Channel, 2019–2027
Figure 58: Latin America Controlled Substance Market Value (US$ Mn) Forecast and Y-o-Y Growth Projection (%), 2017–2027
Figure 59: Latin America Controlled Substance Market Value Share, by Country/Sub-region, 2018 and 2027
Figure 60: Latin America Controlled Substance Market Attractiveness, by Country/Sub-region, 2019–2027
Figure 61: Latin America Controlled Substance Market Value Share, by Drug, 2018 and 2027
Figure 62: Latin America Controlled Substance Market Attractiveness, by Drug, 2019–2027
Figure 63: Latin America Controlled Substance Market Value Share, by Application, 2018 and 2027
Figure 64: Latin America Controlled Substance Market Attractiveness, by Application, 2019–2027
Figure 65: Latin America Controlled Substance Market Value Share, by Distribution Channel, 2018 and 2027
Figure 66: Latin America Controlled Substance Market Attractiveness, by Distribution Channel, 2019–2027
Figure 67: Middle East & Africa Controlled Substance Market Value (US$ Mn) Forecast and Y-o-Y Growth Projection (%), 2017–2027
Figure 68: Middle East & Africa Controlled Substance Market Value Share, by Country/Sub-region, 2018 and 2027
Figure 69: Middle East & Africa Controlled Substance Market Attractiveness, by Country/Sub-region, 2019–2027
Figure 70: Middle East & Africa Controlled Substance Market Value Share, by Drug, 2018 and 2027
Figure 71: Middle East & Africa Controlled Substance Market Attractiveness, by Drug, 2019–2027
Figure 72: Middle East & Africa Controlled Substance Market Value Share, by Application, 2018 and 2027
Figure 73: Middle East & Africa Controlled Substance Market Attractiveness, by Application, 2019–2027
Figure 74: Middle East & Africa Controlled Substance Market Value Share, by Distribution Channel, 2018 and 2027
Figure 75: Middle East & Africa Controlled Substance Market Attractiveness, by Distribution Channel, 2019–2027
Figure 76: Market Position/Ranking Analysis, 2018, by Tier and Size of the Company
Copyright © Transparency Market Research, Inc. All Rights reserved
Trust Online

Controlled Substance Market
