The coding & marking systems market has been severely affected during the pandemic, due to halted businesses, forced lockdown, and disruption in all the supply chain manufacturing activities across the globe. This threatening pandemic has weakened all manufacturing operations in the coding & marking systems market. With the rapid increase in vaccination drives, manufacturers are recovering from the losses by adopting new trends and technologies in the coding & marking systems market. Stakeholders in the coding & marking systems market are focusing on providing environment-friendly solutions to fulfill the rising demand from various end-use industries such as food and packaging. Manufacturers are taking efforts to recover from losses due to COVID-19 outbreak and exploring different opportunities to overcome challenges in the coding & marking systems market.
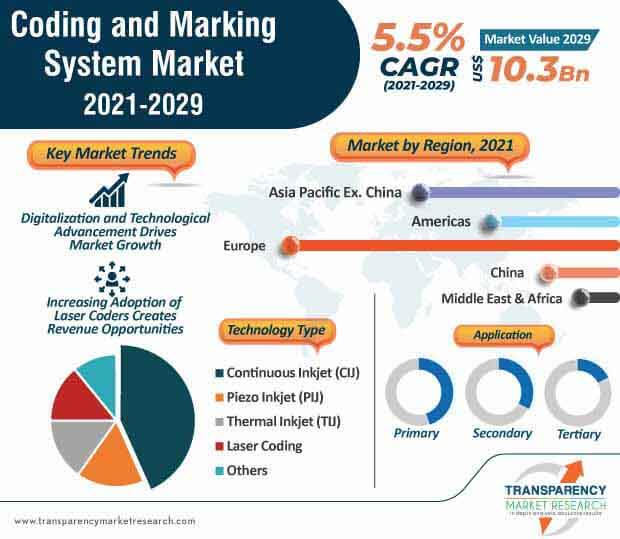
The laser technology has created incremental growth opportunities for the manufacturers operating in the coding & marking systems market. Digitalization and advancements in technologies are responsible for the popularity of laser coders across the globe. Being lucratively used in medicine and pharmaceutical industries, laser coders also proved to be beneficial for the production of vaccines. Manufacturers from coding and marking systems have upgraded their coding technology to meet the rising demand from various manufacturing industries. Laser marking systems are being widely used to print codes on metal products due to its high-speed and sharp marking features. The increasing demand for laser coders drives the global market during the forecast period.
Growing applications of coding and marking systems in product identification and traceability in different industries creates value-grab opportunities for market players. Growth and development of pharmaceuticals, food & beverages, construction, automotive, chemical & fertilizers, and electronics industries demand for printing codes on different products and surfaces and this factor is anticipated to boost the coding & marking systems market at the global level. The increasing popularity of coding and marking is due to their high-resolution images, high speed, and clear & precise printing. Many business leaders are adopting such systems to protect their brand identity. For product sustainability, market contributors are using environment-friendly solutions to use in industrial applications.
The automobile industry is gaining momentum after the threatening coronavirus pandemic. The increase in sales of vehicles across the globe has led to rise in production and manufacturing of automotive parts. In addition, the adoption of electric vehicles also fuels the demand for coding and marking systems to avoid the risk of counterfeiting of vehicle parts. The demand for automotive parts for clear marking and coding for the traceability. Automobile manufacturers are focusing on using high-quality marking systems to protect their brand from any fake activities. This factor boosts the demand for high-resolution, permanent coding on automotive parts. Due to increasing applications in the automobile industry, manufacturers in the coding & marking systems market are paving their ways to make use of technology to fulfill the rising demand.
Coding and marking systems can be increasingly used in food packaging to label the food products. With the increasing need of food quality and safety from all over the world, food manufacturers are using high-resolution coding and marking for labeling the necessary information on the packaged food products. Regulatory guidelines for the food & beverage industry regarding the display and labelling of information create a profitable opportunity for the manufacturers working in the coding & marking systems market. Awareness and adoption of such high-quality codes and marks to print information on food products with high speed and efficiency boost the market growth.
Analysts’ Viewpoint
Laser coders and inkjet printers are anticipated to create revenue opportunities for manufacturers in the coding & marking systems market. The rise in the number of fraudulent activities to suppress the brand value and identity in various industries across the globe is likely to augment the coding & marking systems market in the upcoming years. Technological advancements, along with increasing applications in a variety of industries, is also projected to drive the coding & marking systems market over the next few years. However, market stakeholder should focus on providing cost-effective solutions to fulfill the rising demand from industries.
|
Attribute |
Detail |
|
Market Size Value in 2020 (Base Year) |
US$ 6.3 Bn |
|
Market Forecast Value in 2029 |
US$ 10.3 Bn |
|
Growth Rate (CAGR) |
5.5% |
|
Forecast Period |
2021-2029 |
|
Quantitative Units |
US$ Mn for Value & (000’ Units) for Volume |
|
Market Analysis |
This report represents market dynamics of coding & marking systems and lucrative hotspots of the market. |
|
Competition Landscape |
Competition analysis section in the report represents 5 years performance of the key players and strategies implement by them, along with market share of respective companies in the global market. |
|
Format |
Electronic (PDF) + Excel |
|
Market Segmentation |
|
|
Regions Covered |
|
|
Companies Profiled |
|
|
Customization Scope |
Available upon Request |
|
Pricing |
Available upon Request |
The Coding and Marking System Market is studied from 2021 - 2029.
Coding & Marking Systems Market To Reach Valuation Of US$ 10.3 Bn By 2029.
The coding & marking systems market is anticipated to register growth at 5.5% CAGR during the forecast period.
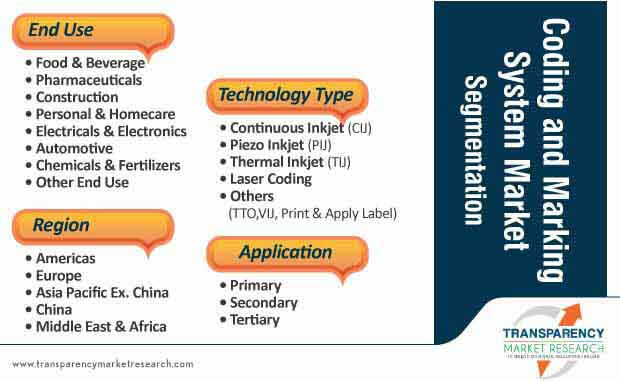
The global Coding and Marking System Market is segmented on basis of application, imaging modality and key regions.
Videojet Technologies, Inc., Hitachi America, Ltd., Markem-Image Corporation, Domino Printing Sciences plc, Squid Ink Manufacturing Inc., ATD Ltd, TYKMA Electrox, Inc, MACSA ID, S.A, REA Elektronik GmbH, Linx Printing Technologies Ltd, RN Mark Inc, Control Print Ltd., etc.
1. Executive Summary
1.1. Market Overview
1.2. Market Analysis
1.3. Analysis and Recommendations
2. Market Viewpoint
2.1. Market Definition
2.2. Market Taxonomy
3. Market Background
3.1. Global Packaging Market Overview
3.2. Global Food & Beverage Market Overview
3.3. Global Pharmaceutical Industry Overview
3.4. Macro-Economic Factors
3.5. Forecast Factors – Relevance & Impact
3.6. Impact of COVID-19 on Coding and Marking System Market
3.7. Value Chain Analysis
3.7.1. Key Participants
3.7.1.1. Component Suppliers
3.7.1.2. Coding and Marking System Manufacturers
3.7.1.3. Distributors
3.7.1.4. End-users
3.7.2. Profitability Margins
4. Coding and Marking System Market Dynamics
4.1. Drivers
4.2. Restraints
4.3. Key Market Regulations/Advisories
4.4. Opportunity Analysis
4.5. Trends
4.6. Application specific Growth Drivers
5. Market Forecast
5.1. Market Volume Projections
5.2. Pricing Analysis
5.3. Market Size Projections
5.3.1. Y-o-Y Projections
5.3.2. Absolute $ Opportunity Analysis
6. Global Coding and Marking System Market Analysis by Technology Type
6.1. Introduction
6.1.1. Market share Analysis by Technology Type
6.1.2. Y-o-Y Growth Analysis by Technology Type
6.2. Market Value (US$ Mn) and Volume (‘000 Units) Historical 2015-2020 and Forecast 2021-2029, by Technology Type
6.2.1. Continuous Inkjet (CIJ)
6.2.2. Piezo Inkjet (PIJ)
6.2.3. Thermal Inkjet (TIJ)
6.2.4. Laser Coding
6.2.5. Others (TTO, VIJ, Print & Apply Label)
6.3. Market Attractiveness Analysis by Technology Type
7. Global Coding and Marking System Market Analysis by Application
7.1. Introduction
7.1.1. Market share Analysis by Application
7.1.2. Y-o-Y Growth Analysis by Application
7.2. Market Value (US$ Mn) and Volume (‘000 Units) Historical 2015-2020 and Forecast 2021-2029, by Application
7.2.1. Primary
7.2.2. Secondary
7.2.3. Tertiary
7.3. Dominant technology within each Market Application
7.4. Market Attractiveness Analysis by Application
8. Global Coding and Marking System Market Analysis by End Use
8.1. Introduction
8.1.1. Market share Analysis by End Use
8.1.2. Y-o-Y Growth Analysis by End Use
8.2. Market Value (US$ Mn) and Volume (‘000 Units) Historical 2015-2020 and Forecast 2021-2029, by End Use
8.2.1. Food & Beverages
8.2.2. Pharmaceuticals
8.2.3. Construction
8.2.4. Personal & Homecare
8.2.5. Electricals & Electronics
8.2.6. Automotive
8.2.7. Chemical & Fertilizers
8.2.8. Other End Use
8.3. Market Attractiveness Analysis by End Use
9. Global Coding and Marking System Market Analysis by Region
9.1. Introduction
9.1.1. Market share Analysis by Region
9.1.2. Y-o-Y Growth Analysis by Region
9.2. Market Value (US$ Mn) and Volume (‘000 Units) Historical 2015-2020 and Forecast 2021-2029, by Region
9.2.1. Americas
9.2.2. China
9.2.3. Europe
9.2.4. Asia Pacific Ex. China
9.3. Market Attractiveness Analysis by Region
10. America Coding and Marking System Market Analysis
10.1. Introduction
10.2. Market Value (US$ Mn) and Volume (‘000 Units) Historical 2015-2020 and Forecast 2021-2029
10.2.1. By Country
10.2.1.1. U.S.
10.2.1.2. Canada
10.2.1.3. Brazil
10.2.1.4. Mexico
10.2.1.5. Rest of Americas
10.2.2. By Technology Type
10.2.2.1. Continuous Inkjet (CIJ)
10.2.2.2. Piezo Inkjet (PIJ)
10.2.2.3. Thermal Inkjet (TIJ)
10.2.2.4. Laser Coding
10.2.2.5. Others (TTO, VIJ, Print & Apply Label)
10.2.3. By Application
10.2.3.1. Primary
10.2.3.2. Secondary
10.2.3.3. Tertiary
10.2.4. By End Use
10.2.4.1. Food & Beverages
10.2.4.2. Pharmaceuticals
10.2.4.3. Construction
10.2.4.4. Personal & Homecare
10.2.4.5. Electricals & Electronics
10.2.4.6. Automotive
10.2.4.7. Chemical & Fertilizers
10.2.4.8. Other End Use
10.3. Market Attractiveness Analysis
10.3.1. By Country
10.3.2. By Technology Type
10.3.3. Application
10.3.4. End Use
10.4. Market Trends
11. Europe Coding and Marking System Market Analysis
11.1. Introduction
11.2. Market Value (US$ Mn) and Volume (‘000 Units) Historical 2015-2020 and Forecast 2021-2029
11.2.1. By Country
11.2.1.1. Germany
11.2.1.2. Italy
11.2.1.3. France
11.2.1.4. U.K.
11.2.1.5. Spain
11.2.1.6. Benelux
11.2.1.7. Nordic
11.2.1.8. Russia
11.2.1.9. Poland
11.2.1.10. Rest of Europe
11.2.2. By Technology Type
11.2.2.1. Continuous Inkjet (CIJ)
11.2.2.2. Piezo Inkjet (PIJ)
11.2.2.3. Thermal Inkjet (TIJ)
11.2.2.4. Laser Coding
11.2.2.5. Others (TTO, VIJ, Print & Apply Label)
11.2.3. By Application
11.2.3.1. Primary
11.2.3.2. Secondary
11.2.3.3. Tertiary
11.2.4. By End Use
11.2.4.1. Food & Beverages
11.2.4.2. Pharmaceuticals
11.2.4.3. Construction
11.2.4.4. Personal & Homecare
11.2.4.5. Electricals & Electronics
11.2.4.6. Automotive
11.2.4.7. Chemical & Fertilizers
11.2.4.8. Other End Use
11.3. Market Attractiveness Analysis
11.3.1. By Country
11.3.2. By Technology Type
11.3.3. Application
11.3.4. End Use
11.4. Market Trends
12. Asia Pacific Ex. China Coding and Marking System Market Analysis
12.1. Introduction
12.2. Market Value (US$ Mn) and Volume (‘000 Units) Historical 2015-2020 and Forecast 2021-2029
12.2.1. By Country
12.2.1.1. India
12.2.1.2. Japan
12.2.1.3. ASEAN
12.2.1.4. South Korea
12.2.1.5. Australia & NZ
12.2.1.6. Rest of APexC
12.2.2. By Technology Type
12.2.2.1. Continuous Inkjet (CIJ)
12.2.2.2. Piezo Inkjet (PIJ)
12.2.2.3. Thermal Inkjet (TIJ)
12.2.2.4. Laser Coding
12.2.2.5. Others (TTO, VIJ, Print & Apply Label)
12.2.3. By Application
12.2.3.1. Primary
12.2.3.2. Secondary
12.2.3.3. Tertiary
12.2.4. By End Use
12.2.4.1. Food & Beverages
12.2.4.2. Pharmaceuticals
12.2.4.3. Construction
12.2.4.4. Personal & Homecare
12.2.4.5. Electricals & Electronics
12.2.4.6. Automotive
12.2.4.7. Chemical & Fertilizers
12.2.4.8. Other End Use
12.3. Market Attractiveness Analysis
12.3.1. By Country
12.3.2. By Technology Type
12.3.3. Application
12.3.4. End Use
12.4. Market Trends
13. China Coding and Marking System Market Analysis
13.1. Introduction
13.2. Market Value (US$ Mn) and Volume (‘000 Units) Historical 2015-2020 and Forecast 2021-2029
13.2.1. By Technology Type
13.2.1.1. Continuous Inkjet (CIJ)
13.2.1.2. Piezo Inkjet (PIJ)
13.2.1.3. Thermal Inkjet (TIJ)
13.2.1.4. Laser Coding
13.2.1.5. Others (TTO, VIJ, Print & Apply Label)
13.2.2. By Application
13.2.2.1. Primary
13.2.2.2. Secondary
13.2.2.3. Tertiary
13.2.3. By End Use
13.2.3.1. Food & Beverages
13.2.3.2. Pharmaceuticals
13.2.3.3. Construction
13.2.3.4. Personal & Homecare
13.2.3.5. Electricals & Electronics
13.2.3.6. Automotive
13.2.3.7. Chemical & Fertilizers
13.2.3.8. Other End Use
13.3. Market Attractiveness Analysis
13.3.1. By Technology Type
13.3.2. Application
13.3.3. End Use
13.4. Market Trends
14. Middle East and Africa Coding and Marking System Market Analysis
14.1. Introduction
14.2. Market Value (US$ Mn) and Volume (‘000 Units) Historical 2015-2020 and Forecast 2021-2029
14.2.1. By Country
14.2.1.1. GCC Countries
14.2.1.2. South Africa
14.2.1.3. Northern Africa
14.2.1.4. Turkey
14.2.1.5. Israel
14.2.1.6. Rest of MEA
14.2.2. By Technology Type
14.2.2.1. Continuous Inkjet (CIJ)
14.2.2.2. Piezo Inkjet (PIJ)
14.2.2.3. Thermal Inkjet (TIJ)
14.2.2.4. Laser Coding
14.2.2.5. Others (TTO, VIJ, Print & Apply Label)
14.2.3. By Application
14.2.3.1. Primary
14.2.3.2. Secondary
14.2.3.3. Tertiary
14.2.4. By End Use
14.2.4.1. Food & Beverages
14.2.4.2. Pharmaceuticals
14.2.4.3. Construction
14.2.4.4. Personal & Homecare
14.2.4.5. Electricals & Electronics
14.2.4.6. Automotive
14.2.4.7. Chemical & Fertilizers
14.2.4.8. Other End Use
14.3. Market Attractiveness Analysis
14.3.1. By Country
14.3.2. By Technology Type
14.3.3. Application
14.3.4. End Use
14.4. Market Trends
15. Market Structure Analysis
15.1. Market Analysis by Tier of Companies
15.1.1. By Large, Medium and Small
15.2. Market Concentration
15.2.1. By Top 5 and by Top 10
15.3. Production Capacity Share Analysis
15.3.1. By Large, Medium, and Small
15.3.2. By Top 5 and Top 10
15.4. Market Share Analysis by Top 10 Players
15.4.1. America Market Share Analysis by Top Players
15.4.2. Europe Market Share Analysis by Top Players
15.4.3. Asia Pacific Market Share Analysis by Top Players
15.5. Market Presence Analysis
15.5.1. By Regional footprint of Players
15.5.2. Product footprint by Players
15.5.3. Channel footprint by Players
16. Competitive Analysis
16.1. Competition Dashboard
16.2. Pricing Analysis by Competition
16.3. Competition Benchmarking
16.4. Thermal Inkjet vs. Piezo Technology: A Detailed Outlook
16.5. TIJ & PIJ Consumables Market Analysis
16.6. Competition Deep Dive
16.6.1. Videojet Technologies, Inc.
16.6.1.1. Overview
16.6.1.2. Product Portfolio (CIJ, TIJ, Piezo, Laser)
16.6.1.3. Profitability by Application/Technology
16.6.1.4. Sales Footprint
16.6.1.5. Channel Footprint
16.6.1.6. Competition Benchmarking
16.6.1.7. Strategy
16.6.2. Hitachi America, Ltd.
16.6.2.1. Overview
16.6.2.2. Product Portfolio (CIJ, TIJ, Piezo, Laser)
16.6.2.3. Profitability by Application/Technology
16.6.2.4. Sales Footprint
16.6.2.5. Channel Footprint
16.6.2.6. Competition Benchmarking
16.6.2.7. Strategy
16.6.3. Markem-Imaje Corporation.
16.6.3.1. Overview
16.6.3.2. Product Portfolio (CIJ, TIJ, Piezo, Laser)
16.6.3.3. Profitability by Application/Technology
16.6.3.4. Sales Footprint
16.6.3.5. Channel Footprint
16.6.3.6. Competition Benchmarking
16.6.3.7. Strategy
16.6.4. Domino Printing Sciences plc.
16.6.4.1. Overview
16.6.4.2. Product Portfolio (CIJ, TIJ, Piezo, Laser)
16.6.4.3. Profitability by Application/Technology
16.6.4.4. Sales Footprint
16.6.4.5. Channel Footprint
16.6.4.6. Competition Benchmarking
16.6.4.7. Strategy
16.6.5. Squid Ink Manufacturing Inc.
16.6.5.1. Overview
16.6.5.2. Product Portfolio (CIJ, TIJ, Piezo, Laser)
16.6.5.3. Profitability by Application/Technology
16.6.5.4. Sales Footprint
16.6.5.5. Channel Footprint
16.6.5.6. Competition Benchmarking
16.6.5.7. Strategy
16.6.6. ATD Ltd.
16.6.6.1. Overview
16.6.6.2. Product Portfolio (CIJ, TIJ, Piezo, Laser)
16.6.6.3. Profitability by Application/Technology
16.6.6.4. Sales Footprint
16.6.6.5. Channel Footprint
16.6.6.6. Competition Benchmarking
16.6.6.7. Strategy
16.6.7. TYKMA Electrox, Inc.
16.6.7.1. Overview
16.6.7.2. Product Portfolio (CIJ, TIJ, Piezo, Laser)
16.6.7.3. Profitability by Application/Technology
16.6.7.4. Sales Footprint
16.6.7.5. Channel Footprint
16.6.7.6. Competition Benchmarking
16.6.7.7. Strategy
16.6.8. MACSA ID, S.A
16.6.8.1. Overview
16.6.8.2. Product Portfolio (CIJ, TIJ, Piezo, Laser)
16.6.8.3. Profitability by Application/Technology
16.6.8.4. Sales Footprint
16.6.8.5. Channel Footprint
16.6.8.6. Competition Benchmarking
16.6.8.7. Strategy.
16.6.9. REA Elektronik GmbH
16.6.9.1. Overview
16.6.9.2. Product Portfolio (CIJ, TIJ, Piezo, Laser)
16.6.9.3. Profitability by Application/Technology
16.6.9.4. Sales Footprint
16.6.9.5. Channel Footprint
16.6.9.6. Competition Benchmarking
16.6.9.7. Strategy
16.6.10. Linx Printing Technologies Ltd.
16.6.10.1. Overview
16.6.10.2. Product Portfolio (CIJ, TIJ, Piezo, Laser)
16.6.10.3. Profitability by Application/Technology
16.6.10.4. Sales Footprint
16.6.10.5. Channel Footprint
16.6.10.6. Competition Benchmarking
16.6.10.7. Strategy
16.6.11. RN Mark Inc.
16.6.11.1. Overview
16.6.11.2. Product Portfolio (CIJ, TIJ, Piezo, Laser)
16.6.11.3. Profitability by Application/Technology
16.6.11.4. Sales Footprint
16.6.11.5. Channel Footprint
16.6.11.6. Competition Benchmarking
16.6.11.7. Strategy
16.6.12. Control Print Ltd.
16.6.12.1. Overview
16.6.12.2. Product Portfolio (CIJ, TIJ, Piezo, Laser)
16.6.12.3. Profitability by Application/Technology
16.6.12.4. Sales Footprint
16.6.12.5. Channel Footprint
16.6.12.6. Competition Benchmarking
16.6.12.7. Strategy
17. Assumptions and Acronyms Used
18. Research Methodology
List of Tables
Table 01: Global Coding and Marking System Market Value (US$ Mn) by Technology Type, 2015H-2029F
Table 02: Global Coding and Marking System Market Volume (‘000 Units) by Technology Type, 2015H-2029F
Table 03: Global Coding and Marking System Market Value (US$ Mn) by Application, 2015H-2029F
Table 04: Global Coding and Marking System Market Volume (‘000 Units) by Application, 2015H-2029F
Table 05: Global Coding and Marking System Market Value (US$ Mn) by End Use, 2015H-2029F
Table 06: Global Coding and Marking System Market Volume (‘000 Units) by End Use, 2015H-2029F
Table 07: Global Coding and Marking System Market Value (US$ Mn) by Region, 2015H-2029F
Table 08: Global Coding and Marking System Market Volume (‘000 Units) by Region, 2015H-2029F
Table 09: Americas Coding and Marking System Market Value (US$ Mn) by Technology Type, 2015H-2029F
Table 10: Americas Coding and Marking System Market Volume (‘000 Units) by Technology Type, 2015H-2029F
Table 11: Americas Coding and Marking System Market Value (US$ Mn) by Application, 2015H-2029F
Table 12: Americas Coding and Marking System Market Volume (‘000 Units) by Application, 2015H-2029F
Table 13: Americas Coding and Marking System Market Value (US$ Mn) by End Use, 2015H-2029F
Table 14: Americas Coding and Marking System Market Volume (‘000 Units) by End Use, 2015H-2029F
Table 15: Americas Coding and Marking System Market Value (US$ Mn) by Country, 2015H-2029F
Table 16: Americas Coding and Marking System Market Volume (‘000 Units) by Country, 2015H-2029F
Table 17: Europe Coding and Marking System Market Value (US$ Mn) by Technology Type, 2015H-2029F
Table 18: Europe Coding and Marking System Market Volume (‘000 Units) by Technology Type, 2015H-2029F
Table 19: Europe America Coding and Marking System Market Value (US$ Mn) by Application, 2015H-2029F
Table 20: Europe America Coding and Marking System Market Volume (‘000 Units) by Application, 2015H-2029F
Table 21: Europe America Coding and Marking System Market Value (US$ Mn) by End Use, 2015H-2029F
Table 22: Europe America Coding and Marking System Market Volume (‘000 Units) by End Use, 2015H-2029F
Table 23: Europe America Coding and Marking System Market Value (US$ Mn) by Country, 2015H-2029F
Table 24: Europe America Coding and Marking System Market Volume (‘000 Units) by Country, 2015H-2029F
Table 25: Asia Pacific Ex. China Coding and Marking System Market Value (US$ Mn) by Technology Type, 2015H-2029F
Table 26: Asia Pacific Ex. China Coding and Marking System Market Volume (‘000 Units) by Technology Type, 2015H-2029F
Table 27: Asia Pacific Ex. China Coding and Marking System Market Value (US$ Mn) by Application, 2015H-2029F
Table 28: Asia Pacific Ex. China Coding and Marking System Market Volume (‘000 Units) by Application, 2015H-2029F
Table 29: Asia Pacific Ex. China Coding and Marking System Market Value (US$ Mn) by End Use, 2015H-2029F
Table 30: Asia Pacific Ex. China Coding and Marking System Market Volume (‘000 Units) by End Use, 2015H-2029F
Table 31: Asia Pacific Ex. China Coding and Marking System Market Value (US$ Mn) by Country, 2015H-2029F
Table 32: Asia Pacific Ex. China Coding and Marking System Market Volume (‘000 Units) by Country, 2015H-2029F
Table 33: China Coding and Marking System Market Value (US$ Mn) by Technology Type, 2015H-2029F
Table 34: China Coding and Marking System Market Volume (‘000 Units) by Technology Type, 2015H-2029F
Table 35: China Coding and Marking System Market Value (US$ Mn) by Application, 2015H-2029F
Table 36: China Coding and Marking System Market Volume (‘000 Units) by Application, 2015H-2029F
Table 37: China Coding and Marking System Market Value (US$ Mn) by End Use, 2015H-2029F
Table 38: China Coding and Marking System Market Volume (‘000 Units) by End Use, 2015H-2029F
Table 39: MEA Coding and Marking System Market Value (US$ Mn) by Technology Type, 2015H-2029F
Table 40: MEA Coding and Marking System Market Volume (‘000 Units) by Technology Type, 2015H-2029F
Table 41: MEA Coding and Marking System Market Value (US$ Mn) by Application, 2015H-2029F
Table 42: MEA Coding and Marking System Market Volume (‘000 Units) by Application, 2015H-2029F
Table 43: MEA Coding and Marking System Market Value (US$ Mn) by End Use, 2015H-2029F
Table 44: MEA Coding and Marking System Market Volume (‘000 Units) by End Use, 2015H-2029F
Table 45: MEA Coding and Marking System Market Value (US$ Mn) by Country, 2015H-2029F
Table 46: MEA Coding and Marking System Market Volume (‘000 Units) by Country, 2015H-2029F
List of Figures
Figure 01: Global Coding and Marking System Market Share Analysis by Technology Type, 2021E & 2029F
Figure 02: Global Coding and Marking System Market Attractiveness Analysis by Technology Type , 2021E-2029F
Figure 03: Global Coding and Marking System Market Y-o-Y Analysis by Technology Type, 2019H-2029F
Figure 04: Global Coding and Marking System Market Share Analysis by Application, 2021E & 2029F
Figure 05: Global Coding and Marking System Market Attractiveness Analysis by Application , 2021E-2029F
Figure 06: Global Coding and Marking System Market Y-o-Y Analysis by Application, 2019H-2029F
Figure 07: Global Coding and Marking System Market Share Analysis by End Use, 2021E & 2029F
Figure 08: Global Coding and Marking System Market Attractiveness Analysis by End Use , 2021E-2029F
Figure 09: Global Coding and Marking System Market Y-o-Y Analysis by End Use, 2019H-2029F
Figure 10: Global Coding and Marking System Market Share Analysis by Region, 2021E & 2029F
Figure 11: Global Coding and Marking System Market Attractiveness Analysis by Region , 2021E-2029F
Figure 12: Global Coding and Marking System Market Y-o-Y Analysis by Region, 2019H-2029F
Figure 13: Americas Coding and Marking System Market Y-o-Y Analysis by Technology Type, 2019H-2029F
Figure 14: Americas Coding and Marking System Market Share Analysis by Application, 2021E & 2029F
Figure 15: Americas Coding and Marking System Market Attractiveness Analysis by End Use, 2021E-2029F
Figure 16: Americas Coding and Marking System Market Value Share Analysis by Country, 2021(E)
Figure 17: Europe America Coding and Marking System Market Y-o-Y Analysis by Technology Type, 2019H-2029F
Figure 18: Europe America Coding and Marking System Market Share Analysis by Application, 2021E & 2029F
Figure 19: Europe America Coding and Marking System Market Attractiveness Analysis by End Use, 2021E-2029F
Figure 20: Europe America Coding and Marking System Market Value Share Analysis by Country, 2021(E)
Figure 21: Asia Pacific Ex. China Coding and Marking System Market Y-o-Y Analysis by Technology Type, 2019H-2029F
Figure 22: Asia Pacific Ex. China Coding and Marking System Market Share Analysis by Application, 2021E & 2029F
Figure 23: Asia Pacific Ex. China Coding and Marking System Market Attractiveness Analysis by End Use, 2021E-2029F
Figure 24: Asia Pacific Ex. China Coding and Marking System Market Value Share Analysis by Country, 2021(E)
Figure 25: China Coding and Marking System Market Y-o-Y Analysis by Technology Type, 2019H-2029F
Figure 26: China Coding and Marking System Market Share Analysis by Application, 2021E & 2029F
Figure 27: China Coding and Marking System Market Attractiveness Analysis by End Use, 2021E-2029F
Figure 28: MEA Coding and Marking System Market Y-o-Y Analysis by Technology Type, 2019H-2029F
Figure 29: MEA Coding and Marking System Market Share Analysis by Application, 2021E & 2029F
Figure 30: MEA Coding and Marking System Market Attractiveness Analysis by End Use, 2021E-2029F
Figure 31: MEA Coding and Marking System Market Value Share Analysis by Country, 2021(E)
Copyright © Transparency Market Research, Inc. All Rights reserved
Trust Online

Coding and Marking System Market
