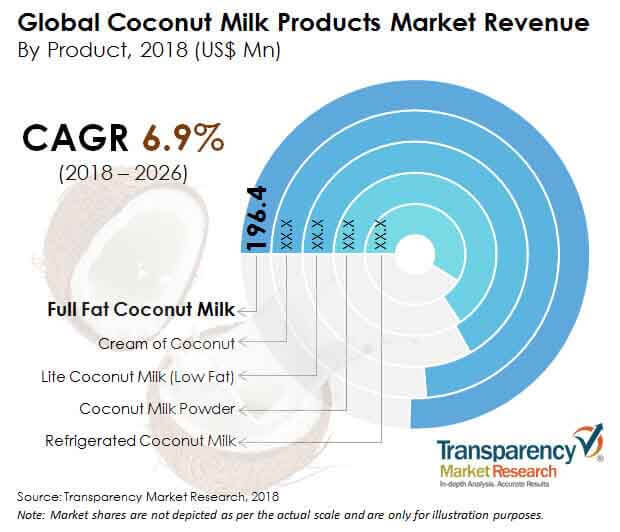
Coconut milk products are obtained from the flesh of matured coconuts, and find a plethora of applications in the food processing industry, food service industry (HoReCa), cosmetics & personal care products, and retail use. Coconut milk products include full fat coconut milk, lite coconut milk (low fat), refrigerated coconut milk, cream of coconut, and coconut milk powder. Coconut milk varies in consistency, added ingredients, and packaging. Coconut milk that is canned, thick, and pure (full fat coconut milk) is used in culinary applications to intensify the flavor and thickness of the dish, whereas, coconut milk that is packed in cartons, thin, and added with flavors, preservatives, and other ingredients is used as an alternative to conventional milk, and also used for direct consumption or as a beverage. Other coconut milk products such as coconut milk cream and coconut milk powder are used in various cuisines and other industries. In terms of value, the global coconut milk products market is expected to reach a market value of US$ 1,508.7 Mn by the end of 2026, with an expected CAGR of 6.9% over the forecast period. The global coconut milk products market is expected to reach a volume production of 752,551 MT in 2026. The drivers for the growth of the coconut milk products market include increasing veganism, growing popularity of Asian cuisines, growing demand for plant-based substitutes, versatile nature of coconut milk products, and increasing dietary restriction among consumers, besides other factors.
Increasing Vegan Population Opening the Way for More Coconut Milk Products
There is an increasing number of individuals who are shifting towards vegan diets, owing to various factors such as issues related to cultural or religious restrictions or limitations, social taboos, or merely because vegetarian diets have been substantiated to be more favorable and healthy as compared to non-vegetarian diets and products over time. In addition, concerns regarding the humanitarian treatment of animals have also been playing a prominent role in the shift towards veganism and vegan diets. Coconut milk products are plant-based alternatives to conventional milk and milk products, and thus, are suitable for those opting for vegan products.
Increasing Popularity of Asian Cuisine Driving the Increased Demand for Coconut Milk Products
Asian cuisines are gaining wide popularity among consumers. Consumers around the world are developing a taste for dishes that contain coconut or coconut milk products. This is a key factor that is expected to drive the growth of the coconut milk products market during the forecast period. Coconut milk products are used extensively in Asian cuisines. The demand for Asian food in regions such as Europe, Canada, and the U.S. has increased substantially, owing to increasing migrating and tourist population.
Increasing Popularity of Various Plant-based Substitutes Accelerating the Demand for Coconut Milk Products
Increasing health and wellness consciousness has led to consumers opting for products that are healthier and more natural. Thus, the market for plant-based substitutes are gaining wide acceptance and popularity all around the world. This factor is further promoting the growth of plant-based coconut milk products.
Multi-purpose Usage of Coconut Milk Products Increasing their Success Factor
Coconut milk products have been witnessing increasing demand for use as substitutes for dairy milk, especially in a number of sweet and savory dishes. Coconut milk products have been traditionally used for cooking purposes, in both, vegetarian and non-vegetarian dishes. Coconut milk also finds application in frozen desserts, pastries, ice creams, sweets etc. It is also used as a thickener in various other dishes, especially in high-end hotel chains that offer Asian cuisines. Coconut milk products are also used in personal care and cosmetic products such as lotions, moisturizers, conditioners, masks, and other products due to its rich oil content and skin soothing properties.
Rising Prevalence of Dietary Restrictions Creating the Demand for Coconut Milk Products
There is a large population suffering from a gastrointestinal condition, known as lactose intolerance. Lactose intolerance prevents individuals from consuming any dairy-based products, leading to several deficiencies. Thus, consumers are shifting to dairy-free or dairy alternative products, hence, creating the demand for dairy-free coconut-based products.
Ingredient and Flavor Innovation in Coconut Milk Products
Manufacturers of coconut milk products are regularly offering consumers more innovative products regarding ingredients and flavors. Innovation in coconut milk products, including beverages, is done to meet the consumer demand for healthier drinks without compromising on the flavor, taste, texture, and nutritional qualities of the product.
Big Names Investing in Smaller Coconut Milk Product Brands and Companies
The recent surge of big food companies acquiring or financing smaller, independent brands is driving the push for the mainstream acceptance of coconut milk products. This is promoting the smaller brands of coconut milk products, helping them gain popularity among consumers. Besides, companies are trying to update their inventories with coconut milk products seeing the consumer trends and preferences for these products.
1. Global Coconut Milk Market - Executive Summary
2. Market Introduction
2.1. Market Definition
2.2. Market Taxonomy
3. Global Coconut Milk Market Analysis Scenario
3.1. Market Volume Projections
3.2. Market Size and Forecast
3.2.1. Market Size and Y-o-Y Growth
3.2.2. Absolute $ Opportunity
4. Market Dynamics
4.1. Global Food & Beverage Sector Outlook
4.2. Macro-economic Factors
4.3. Drivers
4.3.1. Supply Side
4.3.2. Demand Side
4.4. Restraints
4.5. Opportunity
4.6. Trends
4.7. Forecast Factors – Relevance and Impact
4.8. Key Regulations
4.8.1. Organic Claims
4.8.1.1. “100% Organic”
4.8.1.2. “Organic”
4.8.1.3. “Made with Organic ___”
4.8.1.4. “Organic Ingredient ___”
4.8.2. Non-GMO/Not Genetically Engineered
4.8.3. Unrefined & Unbleached
4.8.4. Non-Hydrogenated
4.8.5. Free-from Dairy/Cholesterol-Free Food
4.9. Coconut Milk Consumption/Usage Patterns
4.10. Value Chain Analysis
4.10.1. Ingredient Producers
4.10.2. Coconut milk/cream Processors/Producers
4.10.3. Private Label/Contract Manufacturers
4.10.4. Wholesaler/Distributor/Retailers
4.10.5. Foodservice Food Processors/
4.10.6. Cosmetic & Personal care producers
4.11. Canned V/S Carton Packaged Coconut Milk
4.12. Spending on Dairy alternative Products, by Country/Region
4.13. Marketing & Promotion Strategies
4.14. Comparison of Spending on Dairy Products v/s Dairy Alternatives
4.15. Differences between Coconut Milk and Conventional Dairy Milk
4.15.1. Nutritional Differences
4.15.2. Differences Associated with Production Process
4.15.3. Shelf Life Differences
5. Global Coconut Milk Market Pricing Analysis
5.1. Regional Average Pricing Analysis
5.1.1. North America
5.1.2. Latin America
5.1.3. Europe
5.1.4. Asia Pacific
5.1.5. Middle East & Africa
6. Global Coconut Milk Market Analysis and Forecast, By Nature
6.1. Introduction
6.1.1. Y-o-Y Growth Comparison By Nature
6.1.2. Basis Point Share (BPS) Analysis By Nature
6.2. Historical Market Value (US$ Mn) and Volume (MT) (2013-2017)
6.3. Market Size (US$ Mn) and Volume (MT) Forecast (2018-2026)
6.3.1. Organic
6.3.2. Conventional
6.4. Market Attractiveness Analysis By Nature
7. Global Coconut Milk Market Analysis and Forecast, By Flavor Type
7.1. Introduction
7.1.1. Y-o-Y Growth Comparison By Flavor Type
7.1.2. Basis Point Share (BPS) Analysis By Flavor Type
7.2. Historical Market Value (US$ Mn) and Volume (MT) (2013-2017)
7.3. Market Size (US$ Mn) and Volume (MT) Forecast (2018-2026)
7.3.1. Sweetened
7.3.2. Unsweetened
7.4. Market Attractiveness Analysis By Flavor Type
8. Global Coconut Milk Market Analysis and Forecast, By Product Type
8.1. Introduction
8.1.1. Y-o-Y Growth Comparison By Product Type
8.1.2. Basis Point Share (BPS) Analysis By Product Type
8.2. Historical Market Value (US$ Mn) and Volume (MT) (2013-2017)
8.3. Market Size (US$ Mn) and Volume (MT) Forecast (2018-2026)
8.3.1. Full Fat Coconut Milk
8.3.2. Lite Coconut Milk (Low Fat)
8.3.3. Refrigerated Coconut Milk
8.3.4. Cream of Coconut
8.3.5. Coconut Milk Powder
8.4. Market Attractiveness Analysis By Product Type
9. Global Coconut Milk Market Analysis and Forecast, By End Use
9.1. Introduction
9.1.1. Y-o-Y Growth Comparison By End Use
9.1.2. Basis Point Share (BPS) Analysis By End Use
9.2. Historical Market Value (US$ Mn) and Volume (MT) (2013-2017)
9.3. Market Size (US$ Mn) and Volume (MT) Forecast (2018-2026)
9.3.1. Food and Beverage Manufacturers
9.3.2. Food Services (HoReCa)
9.3.3. Cosmetic & Personal Care
9.3.4. Retail
9.3.4.1. Hypermarkets/Supermarkets
9.3.4.2. Convenience Stores
9.3.4.3. Specialty Sports Stores
9.3.4.4. Food & Drink Specialty Stores
9.3.4.5. Independent Small Groceries
9.3.4.6. Online Retails
9.4. Market Attractiveness Analysis By End Use
10. Global Coconut Milk Market Analysis and Forecast, By Region
10.1. Introduction
10.1.1. Y-o-Y Growth Comparison By Region
10.1.2. Basis Point Share (BPS) Analysis By Region
10.2. Historical Market Value (US$ Mn) and Volume (MT) (2013-2017)
10.3. Market Size (US$ Mn) and Volume (MT) Forecast (2018-2026)
10.3.1. North America
10.3.2. Latin America
10.3.3. Europe
10.3.4. Asia Pacific
10.3.5. Middle East & Africa
10.4. Market Attractiveness Analysis By Region
11. North America Coconut Milk Market Analysis and Forecast
11.1. Introduction
11.2. Regional Trends
11.3. Historical Market Value (US$ Mn) and Volume (MT) (2013-2017) by Market Segment
11.4. Market Size (US$ Mn) and Volume (MT) Forecast (2018-2026), by Market Segment
11.4.1. By Country
11.4.1.1. U.S
11.4.1.2. Canada
11.4.2. By Nature
11.4.3. By Flavor Type
11.4.4. By Product Type
11.4.5. By End Use
11.5. Market Attractiveness Analysis
11.5.1. By Country
11.5.2. By Nature
11.5.3. By Flavor Type
11.5.4. By Product Type
11.5.5. By End Use
11.6. Drivers and Restraints: Impact Analysis
11.7. Key Players
12. Latin America Coconut Milk Market Analysis and Forecast
12.1. Introduction
12.2. Regional Trends
12.3. Historical Market Value (US$ Mn) and Volume (MT) (2013-2017) by Market Segment
12.4. Market Size (US$ Mn) and Volume (MT) Forecast (2018-2026), by Market Segment
12.4.1. By Country
12.4.1.1. Brazil
12.4.1.2. Mexico
12.4.1.3. Rest of Latin America
12.4.2. By Nature
12.4.3. By Flavor Type
12.4.4. By Product Type
12.4.5. By End Use
12.5. Market Attractiveness Analysis
12.5.1. By Nature
12.5.2. By Flavor Type
12.5.3. By Product Type
12.5.4. By End Use
12.6. Drivers and Restraints: Impact Analysis
12.7. Key Players
13. Europe Coconut Milk Market Analysis and Forecast
13.1. Introduction
13.2. Regional Trends
13.3. Historical Market Value (US$ Mn) and Volume (MT) (2013-2017) by Market Segment
13.4. Market Size (US$ Mn) and Volume (MT) Forecast (2018-2026), by Market Segment
13.4.1. By Country
13.4.1.1. Germany
13.4.1.2. France
13.4.1.3. Italy
13.4.1.4. U.K
13.4.1.5. Spain
13.4.1.6. Russia
13.4.1.7. Poland
13.4.1.8. Rest of Europe
13.4.2. By Nature
13.4.3. By Flavor Type
13.4.4. By Product Type
13.4.5. By End Use
13.5. Market Attractiveness Analysis
13.5.1. By Country
13.5.2. By Nature
13.5.3. By Flavor Type
13.5.4. By Product Type
13.5.5. By End Use
13.6. Drivers and Restraints: Impact Analysis
13.7. Key Players
14. Asia Pacific Coconut Milk Market Analysis and Forecast
14.1. Introduction
14.2. Regional Trends
14.3. Historical Market Value (US$ Mn) and Volume (MT) (2013-2017) by Market Segment
14.4. Market Size (US$ Mn) and Volume (MT) Forecast (2018-2026), by Market Segment
14.4.1. By Country
14.4.1.1. India
14.4.1.2. Indonesia
14.4.1.3. Malaysia
14.4.1.4. Philippines
14.4.1.5. Thailand
14.4.1.6. Japan
14.4.1.7. China
14.4.1.8. Australia & New Zealand
14.4.1.9. Rest of APAC
14.4.2. By Nature
14.4.3. By Flavor Type
14.4.4. By Product Type
14.4.5. By End Use
14.5. Market Attractiveness Analysis
14.5.1. By Nature
14.5.2. By Flavor Type
14.5.3. By Product Type
14.5.4. By End Use
14.6. Drivers and Restraints: Impact Analysis
14.7. Key Players
15. Middle East & Africa Coconut Milk Market Analysis and Forecast
15.1. Introduction
15.2. Regional Trends
15.3. Historical Market Value (US$ Mn) and Volume (MT) (2013-2017) by Market Segment
15.4. Market Size (US$ Mn) and Volume (MT) Forecast (2018-2026), by Market Segment
15.4.1. By Country
15.4.1.1. GCC Countries
15.4.1.2. North Africa
15.4.1.3. South Africa
15.4.1.4. Rest of Middle East & Africa
15.4.2. By Nature
15.4.3. By Flavor Type
15.4.4. By Product Type
15.4.5. By End Use
15.5. Market Attractiveness Analysis
15.5.1. By Country
15.5.2. By Nature
15.5.3. By Flavor Type
15.5.4. By Product Type
15.5.5. By End Use
15.6. Drivers and Restraints: Impact Analysis
15.7. Key Players
16. Coconut Milk Market Industry Structure
16.1. Market Analysis by Tier of Companies
16.1.1. By Large, Medium and Small
16.2. Market Concentration
16.2.1. By Top 5 and By Top 10
16.3. Production Capacity Share Analysis
16.3.1. By Large, Medium and Small
16.3.2. By Top 5 and By Top 10
16.4. Market Share Analysis of Top 10 Players, By Region
16.4.1. North America
16.4.2. Latin America
16.4.3. Europe
16.4.4. Asia Pacific
16.4.5. Middle East & Africa
16.5.Market Presence Analysis
16.5.1. By Regional Footprint
16.5.2. By Product Footprint
16.5.3. By Channel Footprint
16.6. Technology Roadmap
17. Competition Landscape
17.1. Competition Dashboard
17.2. Competitive Benchmarking
17.3. Profitability and Gross Margin Analysis By Competition
17.4. Competition Developments (Mergers, Acquisitions and Expansions)
17.5. Competition Deepdive (Tentative List)
17.5.1. McCormick & Co.
17.5.1.1. Overview
17.5.1.2. Product Portfolio
17.5.1.3. Profitability by Market Segments (Product/Channel/Region)
17.5.1.4. Production Footprint
17.5.1.5. Sales Footprint
17.5.1.6. Channel Footprint
17.5.1.7. Gross Margin Benchmarking
17.5.1.8. Strategy Overview
17.5.1.8.1. Marketing Strategy
17.5.1.8.2. Product Strategy
17.5.1.8.3. Channel Strategy
17.5.2. The Whitewave Foods (Danone)
17.5.2.1. Overview
17.5.2.2. Product Portfolio
17.5.2.3. Profitability by Market Segments (Product/Channel/Region)
17.5.2.4. Production Footprint
17.5.2.5. Sales Footprint
17.5.2.6. Channel Footprint
17.5.2.7. Gross Margin Benchmarking
17.5.2.8. Strategy Overview
17.5.2.8.1. Marketing Strategy
17.5.2.8.2. Product Strategy
17.5.2.8.3. Channel Strategy
17.5.3. Goya Foods Inc.
17.5.3.1. Overview
17.5.3.2. Product Portfolio
17.5.3.3. Profitability by Market Segments (Product/Channel/Region)
17.5.3.4. Production Footprint
17.5.3.5. Sales Footprint
17.5.3.6. Channel Footprint
17.5.3.7. Gross Margin Benchmarking
17.5.3.8. Strategy Overview
17.5.3.8.1. Marketing Strategy
17.5.3.8.2. Product Strategy
17.5.3.8.3. Channel Strategy
17.5.4. Theppadungporn Agricultural Industry
17.5.4.1. Overview
17.5.4.2. Product Portfolio
17.5.4.3. Profitability by Market Segments (Product/Channel/Region)
17.5.4.4. Production Footprint
17.5.4.5. Sales Footprint
17.5.4.6. Channel Footprint
17.5.4.7. Gross Margin Benchmarking
17.5.4.8. Strategy Overview
17.5.4.8.1. Marketing Strategy
17.5.4.8.2. Product Strategy
17.5.4.8.3. Channel Strategy
17.5.5. Ducoco Ailmentos SA
17.5.5.1. Overview
17.5.5.2. Product Portfolio
17.5.5.3. Profitability by Market Segments (Product/Channel/Region)
17.5.5.4. Production Footprint
17.5.5.5. Sales Footprint
17.5.5.6. Channel Footprint
17.5.5.7. Gross Margin Benchmarking
17.5.5.8. Strategy Overview
17.5.5.8.1. Marketing Strategy
17.5.5.8.2. Product Strategy
17.5.5.8.3. Channel Strategy
17.5.6. Thai Agri Foods
17.5.7. Celebes Coconut Corporation
17.5.8. Pacific Foods of Oregon
17.5.9. GraceKennedy Group
17.5.10. Thai Coconut Public Company Limited
17.5.11. M&S Food Industries
17.5.12. The Sambu Group
17.5.13. Fresh Fruit Ingredients Inc.
17.5.14. Chef’s Choice Food Manufacturer Company Limited
17.5.15. Roxas Sigma Agriventures, Inc
18. Assumptions & Acronyms Used
Research Methodology
List of Table
Table 01: Global Coconut Milk Market Value (US$ Mn) Forecast by Nature, 2018–2026
Table 02: Global Coconut Milk Market Volume (MT) Forecast by Nature, 2018–2026
Table 03: Global Coconut Milk Market Value (US$ Mn) Forecast by Flavor Type, 2018–2026
Table 04: Global Coconut Milk Market Volume (MT) Forecast by Flavor Type, 2018–2026
Table 05: Global Coconut Milk Market Value (US$ Mn) Forecast by Product Type, 2018–2026
Table 06: Global Coconut Milk Market Volume (MT) Forecast by Product Type, 2018–2026
Table 07: Global Coconut Milk Market Value (US$ Mn) Forecast by End Use, 2018–2026
Table 08: Global Coconut Milk Market Volume (MT) Forecast by End Use, 2018–2026
Table 09: Global Coconut Milk Market Value (US$ Mn) Forecast by Region, 2018–2026
Table 10: Global Coconut Milk Market Volume (MT) Forecast by Region, 2018–2026
Table 11: North America Coconut Milk Market Value (US$ Mn) Forecast by Country, 2018–2026
Table 12: North America Coconut Milk Market Volume (MT) Forecast by Country, 2018–2026
Table 13: North America Coconut Milk Market Value (US$ Mn) Forecast by Nature, 2018–2026
Table 14: North America Coconut Milk Market Volume (MT) Forecast by Nature, 2018–2026
Table 15: North America Coconut Milk Market Value (US$ Mn) Forecast by Flavor Type, 2018–2026
Table 16: North America Coconut Milk Market Volume (MT) Forecast by Flavor Type, 2018–2026
Table 17: North America Coconut Milk Market Value (US$ Mn) Forecast by Product Type, 2018–2026
Table 18: North America Coconut Milk Market Volume (MT) Forecast by Product Type, 2018–2026
Table 19: North America Coconut Milk Market Value (US$ Mn) Forecast by End Use, 2018–2026
Table 20: North America Coconut Milk Market Volume (MT) Forecast by End Use, 2018–2026
Table 21: Latin America Coconut Milk Market Value (US$ Mn) Forecast by Country, 2018–2026
Table 22: Latin America Coconut Milk Market Volume (MT) Forecast by Country, 2018–2026
Table 23: Latin America Coconut Milk Market Value (US$ Mn) Forecast by Nature, 2018–2026
Table 24: Latin America Coconut Milk Market Volume (MT) Forecast by Nature, 2018–2026
Table 25: Latin America Coconut Milk Market Value (US$ Mn) Forecast by Flavor Type, 2018–2026
Table 26: Latin America Coconut Milk Market Volume (MT) Forecast by Flavor Type, 2018–2026
Table 27: Latin America Coconut Milk Market Value (US$ Mn) Forecast by Product Type, 2018–2026
Table 28: Latin America Coconut Milk Market Volume (MT) Forecast by Product Type, 2018–2026
Table 29: Latin America Coconut Milk Market Value (US$ Mn) Forecast by End Use, 2018–2026
Table 30: Latin America Coconut Milk Market Volume (MT) Forecast by End Use, 2018–2026
Table 31: Europe Coconut Milk Market Value (US$ Mn) Forecast by Country, 2018–2026
Table 32: Europe Coconut Milk Market Volume (MT) Forecast by Country, 2018–2026
Table 33: Europe Coconut Milk Market Value (US$ Mn) Forecast by Nature, 2018–2026
Table 34: Europe Coconut Milk Market Volume (MT) Forecast by Nature, 2018–2026
Table 35: Europe Coconut Milk Market Value (US$ Mn) Forecast by Flavor Type, 2018–2026
Table 36: Europe Coconut Milk Market Volume (MT) Forecast by Flavor Type, 2018–2026
Table 37: Europe Coconut Milk Market Value (US$ Mn) Forecast by Product Type, 2018–2026
Table 38: Europe Coconut Milk Market Volume (MT) Forecast by Product Type, 2018–2026
Table 39: Europe Coconut Milk Market Value (US$ Mn) Forecast by End Use, 2018–2026
Table 40: Europe Coconut Milk Market Volume (MT) Forecast by End Use, 2018–2026
Table 41: APAC Coconut Milk Market Value (US$ Mn) Forecast by Country, 2018–2026
Table 42: APAC Coconut Milk Market Volume (MT) Forecast by Country, 2018–2026
Table 43: APAC Coconut Milk Market Value (US$ Mn) Forecast by Nature, 2018–2026
Table 44: APAC Coconut Milk Market Volume (MT) Forecast by Nature, 2018–2026
Table 45: APAC Coconut Milk Market Value (US$ Mn) Forecast by Flavor Type, 2018–2026
Table 46: APAC Coconut Milk Market Volume (MT) Forecast by Flavor Type, 2018–2026
Table 47: APAC Coconut Milk Market Value (US$ Mn) Forecast by Product Type, 2018–2026
Table 48: APAC Coconut Milk Market Volume (MT) Forecast by Product Type, 2018–2026
Table 49: APAC Coconut Milk Market Value (US$ Mn) Forecast by End Use, 2018–2026
Table 50: APAC Coconut Milk Market Volume (MT) Forecast by End Use, 2018–2026
Table 51: MEA Coconut Milk Market Value (US$ Mn) Forecast by Country, 2018–2026
Table 52: MEA Coconut Milk Market Volume (MT) Forecast by Country, 2018–2026
Table 53: MEA Coconut Milk Market Value (US$ Mn) Forecast by Nature, 2018–2026
Table 54: MEA Coconut Milk Market Volume (MT) Forecast by Nature, 2018–2026
Table 55: MEA Coconut Milk Market Value (US$ Mn) Forecast by Flavor Type, 2018–2026
Table 56: MEA Coconut Milk Market Volume (MT) Forecast by Flavor Type, 2018–2026
Table 57: MEA Coconut Milk Market Value (US$ Mn) Forecast by Product Type, 2018–2026
Table 58: MEA Coconut Milk Market Volume (MT) Forecast by Product Type, 2018–2026
Table 59: MEA Coconut Milk Market Value (US$ Mn) Forecast by End Use, 2018–2026
Table 60: MEA Coconut Milk Market Volume (MT) Forecast by End Use, 2018–2026
List of Figure
Figure 1: Global Coconut Milk Market Volume (MT) Analysis by Nature, 2018 & 2026
Figure 2: Global Coconut Milk Market Value (US$ Mn) Analysis by Nature, 2018 & 2026
Figure 3: Global Coconut Milk Market Value Share (%) and BPS Analysis by Nature, 2018 & 2026
Figure 4: Global Coconut Milk Market Y-o-Y Growth (%) Projections by Nature, 2018-2026
Figure 5: Global Coconut Milk Market Volume (MT) Analysis by Flavor Type, 2018 & 2026
Figure 6: Global Coconut Milk Market Value (US$ Mn) Analysis by Flavor Type, 2018 & 2026
Figure 7: Global Coconut Milk Market Value Share (%) and BPS Analysis by Flavor Type, 2018 & 2026
Figure 8: Global Coconut Milk Market Y-o-Y Growth (%) Projections by Flavor Type, 2018-2026
Figure 9: Global Coconut Milk Market Volume (MT) Analysis by Product Type, 2018 & 2026
Figure 10: Global Coconut Milk Market Value (US$ Mn) Analysis by Product Type, 2018 & 2026
Figure 11: Global Coconut Milk Market Value Share (%) and BPS Analysis by Product Type, 2018 & 2026
Figure 12: Global Coconut Milk Market Y-o-Y Growth (%) Projections by Product Type, 2018-2026
Figure 13: Global Coconut Milk Market Volume (MT) Analysis by End Use, 2018 & 2026
Figure 14: Global Coconut Milk Market Value (US$ Mn) Analysis by End Use, 2018 & 2026
Figure 15: Global Coconut Milk Market Value Share (%) and BPS Analysis by End Use, 2018 & 2026
Figure 16: Global Coconut Milk Market Y-o-Y Growth (%) Projections by End Use, 2018-2026
Figure 17: Global Coconut Milk Market Volume (MT) Analysis by Region, 2018 & 2026
Figure 18: Global Coconut Milk Market Value (US$ Mn) Analysis by Region, 2018 & 2026
Figure 19: Global Coconut Milk Market Value Share (%) and BPS Analysis by Region, 2018 & 2026
Figure 20: Global Coconut Milk Market Y-o-Y Growth (%) Projections by Region, 2018-2026
Figure 21: Global Coconut Milk Market Attractiveness Analysis, by Nature, 2018 & 2026
Figure 22: Global Coconut Milk Market Attractiveness Analysis, by Flavor Type, 2018 & 2026
Figure 23: Global Coconut Milk Market Attractiveness Analysis, by Product Type
Figure 24: Global Coconut Milk Market Attractiveness Analysis, by End Use
Figure 25: Global Coconut Milk Market Attractiveness Analysis, by Region
Figure 26: North America Coconut Milk Market Value Share (%) and BPS Analysis by Country, 2018 & 2026
Figure 27: North America Coconut Milk Market Y-o-Y Growth (%) Projections by Country, 2018-2026
Figure 28: North America Coconut Milk Market Value Share (%) and BPS Analysis by Nature, 2018 & 2026
Figure 29: North America Coconut Milk Market Y-o-Y Growth (%) Projections by Nature, 2018-2026
Figure 30: North America Coconut Milk Market Value Share (%) and BPS Analysis by Flavor Type, 2018 & 2026
Figure 31: North America Coconut Milk Market Y-o-Y Growth (%) Projections by Flavor Type, 2018-2026
Figure 32: North America Coconut Milk Market Value Share (%) and BPS Analysis by Product Type, 2018 & 2026
Figure 33: North America Coconut Milk Market Y-o-Y Growth (%) Projections by Product Type, 2018-2026
Figure 34: North America Coconut Milk Market Value Share (%) and BPS Analysis by End Use, 2018 & 2026
Figure 35: North America Coconut Milk Market Y-o-Y Growth (%) Projections by End Use, 2018-2026
Figure 36: North America Coconut Milk Market Attractiveness Analysis, by Nature, 2018 & 2026
Figure 37: North America Coconut Milk Market Attractiveness Analysis, by Flavor Type, 2018 & 2026
Figure 38: North America Coconut Milk Market Attractiveness Analysis, by Product Type
Figure 39: North America Coconut Milk Market Attractiveness Analysis, by End Use
Figure 40: North America Coconut Milk Market Attractiveness Analysis, by Country
Figure 41: Latin America Coconut Milk Market Value Share (%) and BPS Analysis by Country, 2018 & 2026
Figure 42: Latin America Coconut Milk Market Y-o-Y Growth (%) Projections by Country, 2018-2026
Figure 43: Latin America Coconut Milk Market Value Share (%) and BPS Analysis by Nature, 2018 & 2026
Figure 44: Latin America Coconut Milk Market Y-o-Y Growth (%) Projections by Nature, 2018-2026
Figure 45: Latin America Coconut Milk Market Value Share (%) and BPS Analysis by Flavor Type, 2018 & 2026
Figure 46: Latin America Coconut Milk Market Y-o-Y Growth (%) Projections by Flavor Type, 2018-2026
Figure 47: Latin America Coconut Milk Market Value Share (%) and BPS Analysis by Product Type, 2018 & 2026
Figure 48: Latin America Coconut Milk Market Y-o-Y Growth (%) Projections by Product Type, 2018-2026
Figure 49: Latin America Coconut Milk Market Value Share (%) and BPS Analysis by End Use, 2018 & 2026
Figure 50: Latin America Coconut Milk Market Y-o-Y Growth (%) Projections by End Use, 2018-2026
Figure 51: Latin America Coconut Milk Market Attractiveness Analysis, by Nature, 2018 & 2026
Figure 52: Latin America Coconut Milk Market Attractiveness Analysis, by Flavor Type, 2018 & 2026
Figure 53: Latin America Coconut Milk Market Attractiveness Analysis, by Product Type
Figure 54: Latin America Coconut Milk Market Attractiveness Analysis, by End Use
Figure 55: Latin America Coconut Milk Market Attractiveness Analysis, by Country
Figure 56: Europe Coconut Milk Market Value Share (%) and BPS Analysis by Country, 2018 & 2026
Figure 57: Europe Coconut Milk Market Y-o-Y Growth (%) Projections by Country, 2018-2026
Figure 58: Europe Coconut Milk Market Value Share (%) and BPS Analysis by Nature, 2018 & 2026
Figure 59: Europe Coconut Milk Market Y-o-Y Growth (%) Projections by Nature, 2018-2026
Figure 60: Europe Coconut Milk Market Value Share (%) and BPS Analysis by Flavor Type, 2018 & 2026
Figure 61: Europe Coconut Milk Market Y-o-Y Growth (%) Projections by Flavor Type, 2018-2026
Figure 62: Europe Coconut Milk Market Value Share (%) and BPS Analysis by Product Type, 2018 & 2026
Figure 63: Europe Coconut Milk Market Y-o-Y Growth (%) Projections by Product Type, 2018-2026
Figure 64: Europe Coconut Milk Market Value Share (%) and BPS Analysis by End Use, 2018 & 2026
Figure 65: Europe Coconut Milk Market Y-o-Y Growth (%) Projections by End Use, 2018-2026
Figure 66: Europe Coconut Milk Market Attractiveness Analysis, by Nature, 2018 & 2026
Figure 67: Europe Coconut Milk Market Attractiveness Analysis, by Flavor Type, 2018 & 2026
Figure 68: Europe Coconut Milk Market Attractiveness Analysis, by Product Type
Figure 69: Europe Coconut Milk Market Attractiveness Analysis, by End Use
Figure 70: Europe Coconut Milk Market Attractiveness Analysis, by Country
Figure 71: APAC Coconut Milk Market Value Share (%) and BPS Analysis by Country, 2018 & 2026
Figure 72: APAC Coconut Milk Market Y-o-Y Growth (%) Projections by Country, 2018-2026
Figure 73: APAC Coconut Milk Market Value Share (%) and BPS Analysis by Nature, 2018 & 2026
Figure 74: APAC Coconut Milk Market Y-o-Y Growth (%) Projections by Nature, 2018-2026
Figure 75: APAC Coconut Milk Market Value Share (%) and BPS Analysis by Flavor Type, 2018 & 2026
Figure 76: APAC Coconut Milk Market Y-o-Y Growth (%) Projections by Flavor Type, 2018-2026
Figure 77: APAC Coconut Milk Market Value Share (%) and BPS Analysis by Product Type, 2018 & 2026
Figure 78: APAC Coconut Milk Market Y-o-Y Growth (%) Projections by Product Type, 2018-2026
Figure 79: APAC Coconut Milk Market Value Share (%) and BPS Analysis by End Use, 2018 & 2026
Figure 80: APAC Coconut Milk Market Y-o-Y Growth (%) Projections by End Use, 2018-2026
Figure 81: APAC Coconut Milk Market Attractiveness Analysis, by Nature, 2018 & 2026
Figure 82: APAC Coconut Milk Market Attractiveness Analysis, by Flavor Type, 2018 & 2026
Figure 83: APAC Coconut Milk Market Attractiveness Analysis, by Product Type
Figure 84: APAC Coconut Milk Market Attractiveness Analysis, by End Use
Figure 85: APAC Coconut Milk Market Attractiveness Analysis, by Country
Figure 86: MEA Coconut Milk Market Value Share (%) and BPS Analysis by Country, 2018 & 2026
Figure 87: MEA Coconut Milk Market Y-o-Y Growth (%) Projections by Country, 2018-2026
Figure 88: MEA Coconut Milk Market Value Share (%) and BPS Analysis by Nature, 2018 & 2026
Figure 89: MEA Coconut Milk Market Y-o-Y Growth (%) Projections by Nature, 2018-2026
Figure 90: MEA Coconut Milk Market Value Share (%) and BPS Analysis by Flavor Type, 2018 & 2026
Figure 91: MEA Coconut Milk Market Y-o-Y Growth (%) Projections by Flavor Type, 2018-2026
Figure 92: MEA Coconut Milk Market Value Share (%) and BPS Analysis by Product Type, 2018 & 2026
Figure 93: MEA Coconut Milk Market Y-o-Y Growth (%) Projections by Product Type, 2018-2026
Figure 94: MEA Coconut Milk Market Value Share (%) and BPS Analysis by End Use, 2018 & 2026
Figure 95: MEA Coconut Milk Market Y-o-Y Growth (%) Projections by End Use, 2018-2026
Figure 96: MEA Coconut Milk Market Attractiveness Analysis, by Nature, 2018 & 2026
Figure 97: MEA Coconut Milk Market Attractiveness Analysis, by Flavor Type, 2018 & 2026
Figure 98: MEA Coconut Milk Market Attractiveness Analysis, by Product Type
Figure 99: MEA Coconut Milk Market Attractiveness Analysis, by End Use
Figure 100: MEA Coconut Milk Market Attractiveness Analysis, by Country
Copyright © Transparency Market Research, Inc. All Rights reserved
Trust Online

Coconut Milk Products Market
