Cheated minerals have gained tremendous popularity due to increasing health risks during the coronavirus outbreak. The increasing demand for dietary supplements of cheated minerals to boost immunity and improve digestion by boosting the absorption process in the body help market players to establish and grow their businesses. The insufficient intake of nutrients such as iron, zinc, B12, and calcium can cause many health issues. Chelated minerals are made by combining with amino acids for better absorption and to achieve optimal bioavailability. The increasing awareness about health, nutrition, and dietary supplements required for our body to work efficiently boosts the global chelated minerals market during the COVID-19. Manufacturers operating in the chelated minerals market are targeting on increasing production to cater demands from consumers.
With the increasing trend and popularity of vegan diet or veganism across the globe, there is a rising demand for dietary supplements to fulfill the minerals demand of the body. Minerals and nutrients are essential to perform different functions of the body. Vegan or plant-based food is found to create deficiency of some essential minerals such as vitamin B12, vitamin D, iron, etc. Eliminating eggs, meat, and dairy products from your diet can create some severe health complications. This can increase the chances of taking dietary supplements to stay healthy. Another reason for the growth of the chelated minerals market is health consciousness and increasing spending on health supplements due to their proven health benefits.
Increasing consumption of packaged food, smoking habits, and disturbed sleep cycle, and rising cases of nutritional deficiencies among consumers across the globe drive the global chelated minerals market. There is a need of consuming healthy diet, along with necessary dietary supplements to avoid any nutritional deficiencies of minerals protein, vitamin, zinc, iron, etc. The insufficient intake of such minerals can cause depressed immune function and increased susceptibility to diseases. Chelated minerals are the absorbable form of active minerals. This has been found that chelated minerals are absorbed better than the regular minerals. They are helpful for bodily functions, improving immunity and digestion. Other benefits are to build strong muscles and bones, improving defense mechanism, and maintaining tolerance.
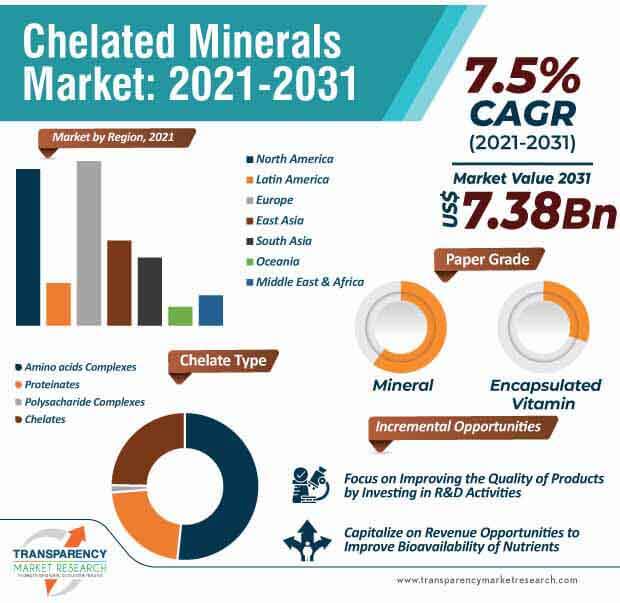
The chelated minerals market is expected to rise at a CAGR of 7.5% during the forecast period. The Chelated minerals market is estimated to cross the valuation of US$ 7.38 Bn by 2031. The increasing popularity of organic and nutritional products is gaining momentum due to changing lifestyles of consumers. These products can have a number of health benefits if taken in the appropriate manner. Chelated minerals can be widely used in animal nutrition (Poultry, ruminant, aquaculture, etc.). Organic chelates are used to increase the bioavailability of minerals by increasing absorption. This helps in avoiding any interference with other minerals. Health practitioners should focus on increasing awareness about chelated minerals and their doses depending on age of consumers, health issues, etc.
Increasing sales of chelated minerals amid the terrifying coronavirus pandemic help product manufacturers to establish their businesses by competing with top market players. The spreading of coronavirus creates lucrative opportunities for market contributors in chelated minerals market. The increase in the number of offline distribution channels such as drugs and pharmaceutical stores, advancement in eCommerce, and rapidly expanding online distribution channels boost the sales of chelated minerals. Manufacturing companies in the chelated minerals market are focusing on fulfilling nutritional demands from consumers. Consistent research and technological advancement in dietary and nutritional supplements to boost immunity and energy levels help grow businesses exponentially. Manufacturers in the chelated minerals market are exploring opportunities to introduce good quality products that are rich in amino acids, proteinate, and polysaccharide complexes.
Analysts’ Viewpoint
With the proven health and nutritional benefits of chelated minerals for wellness of human as well as animals, there is an increasing demand for these supplements across the globe. Being more superior to inorganic minerals, chelated minerals offer lucrative opportunities in the dietary supplement market. People are now more conscious about the food they incorporate in their daily life. Product manufacturers are taking efforts to increase the production of chelated minerals to cater the increasing demand from consumers. There are increasing applications of chelated minerals in the animal feed industry for better absorption of minerals. Asia Pacific accounts for the fastest growing market due to increasing awareness of dietary supplements. However, market players should increase the R&D activities in dietary supplements to improve product quality and create more revenue opportunities.
Chelated Minerals Market Snapshot
|
Attribute |
Detail |
|
Market Size Value in 2021 (Base Year) |
USD 3.57 Bn |
|
Market Forecast Value in 2031 |
USD 7.38 Bn |
|
Growth Rate (CAGR) |
7.5% |
|
Forecast Period |
2021-2031 |
|
Quantitative Units |
US$ Mn for Value & Tons for Volume |
|
Market Analysis |
It includes cross segment analysis at global as well as regional level. Furthermore, qualitative analysis includes drivers, restraints, opportunities, key trends, Porters Five Forces analysis, supply chain analysis, parent industry overview, etc. |
|
Competition Landscape |
|
|
Format |
Electronic (PDF) + Excel |
|
Market Segmentation |
|
|
Regions Covered |
|
|
Countries Covered |
|
|
Companies Profiled |
|
|
Customization Scope |
Available upon Request |
|
Pricing |
Available upon Request |
Chelated Minerals Market is expected to reach US$ 7.38 Bn in 2031
Chelated Minerals Market is estimated to rise at a CAGR of 7.5% during forecast period
Increasing demand for dietary supplements is driving the growth of the Chelated Minerals Market
South Asia and East Asia are more attractive for vendors in the Chelated Minerals Market
Key players of Chelated Minerals Market are Zinpro Corp, Maru Chem Industries, Glanbia PLC, Balchem Inc, Virbac, LMF Feeds Inc, Cargill Inc, Alltech, Kemin Industries Inc, BASF SE, Nutreco, NOW Foods, Novus International Inc, Bluestar Adisseo Co Ltd, Koninklijke DSM N.V, Phoenix Nutrition, Archer Daniel Midland Company, Phibro Animal Health Corporation (PAHC), Lehmann&Voss&Co, Prathista Industries Limited
1. Executive Summary
1.1. Global Market Outlook
1.2. Demand Side Trends
1.3. Supply Side Trends
1.4. Analysis and Recommendations
2. Market Overview
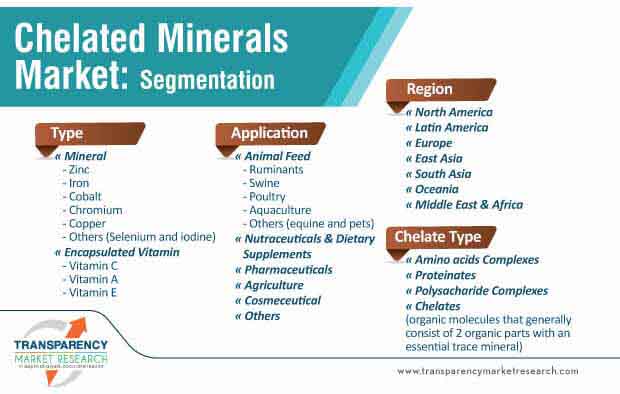
2.1. Market Coverage / Taxonomy
2.2. Market Definition / Scope / Limitations
3. Market Background
3.1. Global Overview
3.2. Macro-Economic Factors
3.2.1. Global GDP Growth Outlook
3.2.2. Global Industry Value Added
3.2.3. Global Urbanization Growth Outlook
3.2.4. Global Food Security Index Outlook
3.2.5. Global Rank – Ease of Doing Business
3.2.6. Global Rank – Trading Across Borders
3.3. Impact of COVID-19 on Nutraceutical Industry
3.3.1. Manufacturer/Processors
3.3.2. Supply Chain and Logistics
3.3.3. Wholesalers/Traders
3.3.4. End Users
3.4. Global Animal Feed Industry Outlook
3.5. Global Nutraceutical Industry Outlook
3.6. Global Cosmetic & Personal Care Industry Overview
3.7. Global Pharmaceutical Industry Overview
3.8. End User Industry Demand Analysis
3.9. Key Labelling/Certifications
3.10. Value Chain
3.10.1. Profit Margin Analysis at each point of sales
3.10.1.1. Producers/Processors
3.10.1.2. Distributors/Suppliers/Wholesalers
3.10.1.3. End Users
3.11. Market Dynamics
3.11.1. Drivers
3.11.2. Restraints
3.11.3. Opportunity Analysis
3.12. Forecast Factors - Relevance & Impact
4. Key Market Trends
4.1. Key Trends Impacting the Market
4.2. High Demand for Organic Products
4.3. Consumer demand for Kosher friendly, Non GMO products growing and this is being reflected in spending patterns
4.4. Greater demand for healthy options and ‘clean label’ products
5. Key Success Factors
5.1. Product Innovation / Development Trends
5.2. Strategic Promotional Strategies
6. Global Chelated Minerals Market Demand Analysis 2016–2020 and Forecast, 2021–2031
6.1. Historical Market Volume (Tons) Analysis, 2016–2020
6.2. Current and Future Market Volume (Tons) Projections, 2021–2031
7. Global Chelated Minerals Market - Pricing Analysis
7.1. Regional Pricing Analysis
7.2. Global Average Pricing Analysis Benchmark
8. Global Chelated Minerals Market Demand (in Value or Size in US$ Mn) Analysis 2016–2020 and Forecast, 2021–2031
8.1. Historical Market Value (US$ Mn) Analysis, 2016–2020
8.2. Current and Future Market Value (US$ Mn) Projections, 2021–2031
8.2.1. Y-o-Y Growth Trend Analysis
8.2.2. Absolute $ Opportunity Analysis
9. Global Chelated Minerals Market Analysis 2016–2020 and Forecast 2021–2031, By Type
9.1. Introduction / Key Findings
9.2. Historical Market Size (US$ Mn) and Volume Analysis By Type, 2016–2020
9.3. Current and Future Market Size (US$ Mn) and Volume Analysis and Forecast By Type, 2021–2031
9.3.1.1. Zinc
9.3.1.2. Iron
9.3.1.3. Cobalt
9.3.1.4. Chromium
9.3.1.5. Copper
9.3.1.6. Others (Selenium and iodine)
9.4. Market Attractiveness Analysis By Type
10. Global Chelated Minerals Market Analysis 2016–2020 and Forecast 2021–2031, By Chelate Type
10.1. Introduction / Key Findings
10.2. Historical Market Size (US$ Mn) and Volume Analysis By Chelate Type, 2016–2020
10.3. Current and Future Market Size (US$ Mn) and Volume Analysis and Forecast By Chelate Type, 2021–2031
10.3.1. Amino acids Complexes
10.3.2. Proteinates
10.3.3. Polysacharide Complexes
10.3.4. Chelates
10.4. Market Attractiveness Analysis By Chelate Type
11. Global Chelated Minerals Market Analysis 2016–2020 and Forecast 2021–2031, By Application
11.1. Introduction / Key Findings
11.2. Historical Market Size (US$ Mn) and Volume Analysis By Application, 2016–2020
11.3. Current and Future Market Size (US$ Mn) and Volume Analysis and Forecast By Application, 2021–2031
11.3.1. Animal Feed
11.3.1.1. Ruminants
11.3.1.2. Swine
11.3.1.3. Poultry
11.3.1.4. Aquaculture
11.3.1.5. Others (equine and pets)
11.3.2. Nutraceuticals & Dietary Supplements
11.3.3. Pharmaceuticals
11.3.4. Agriculture
11.3.5. Others
11.4. Market Attractiveness Analysis By Application
12. Global Chelated Minerals Market Analysis 2016–2020 and Forecast 2021–2031, by Region
12.1. Introduction
12.2. Historical Market Size (US$ Mn) and Volume Analysis By Region, 2016–2020
12.3. Current Market Size (US$ Mn) and Volume Analysis and Forecast By Region, 2021–2031
12.3.1. North America
12.3.2. Latin America
12.3.3. Europe
12.3.4. East Asia
12.3.5. South Asia
12.3.6. Oceania
12.3.7. Middle East and Africa (MEA)
12.4. Market Attractiveness Analysis By Region
13. North America Chelated Minerals Market Analysis 2016-2020 and Forecast 2021-2031
13.1. Introduction
13.2. Historical Market Size (US$ Mn) and Volume Trend Analysis By Market Taxonomy, 2016-2020
13.3. Market Size (US$ Mn) and Volume Forecast By Market Taxonomy, 2021-2031
13.3.1. By Country
13.3.1.1. U.S.
13.3.1.2. Canada
13.3.2. By Type
13.3.3. By Chelate Type
13.3.4. By Application
13.4. Market Attractiveness Analysis
13.4.1. By Country
13.4.2. By Type
13.4.3. By Chelate Type
13.4.4. By Application
13.5. Drivers and Restraints - Impact Analysis
14. U.S. Chelated Minerals Market Analysis 2016-2020 and Forecast 2021-2031
14.1. Introduction
14.2. Historical Market Size (US$ Mn) and Volume Trend Analysis By Market Taxonomy, 2016-2020
14.3. Market Size (US$ Mn) and Volume Forecast By Market Taxonomy, 2021-2031
14.3.1. By Type
14.3.2. By Chelate Type
14.3.3. By Application
14.4. Market Attractiveness Analysis
14.4.1. By Type
14.4.2. By Chelate Type
14.4.3. By Application
14.5. Drivers and Restraints - Impact Analysis
15. Latin America Chelated Minerals Market Analysis 2016-2020 and Forecast 2021-2031
15.1. Introduction
15.2. Historical Market Size (US$ Mn) and Volume Trend Analysis By Market Taxonomy, 2016-2020
15.3. Market Size (US$ Mn) and Volume Forecast By Market Taxonomy, 2021-2031
15.3.1. By Country
15.3.1.1. Brazil
15.3.1.2. Mexico
15.3.1.3. Rest of Latin America
15.3.2. By Type
15.3.3. By Chelate Type
15.3.4. By Application
15.4. Market Attractiveness Analysis
15.4.1. By Country
15.4.2. By Type
15.4.3. By Chelate Type
15.4.4. By Application
15.5. Drivers and Restraints - Impact Analysis
16. Europe Chelated Minerals Market Analysis 2016-2020 and Forecast 2021-2031
16.1. Introduction
16.2. Historical Market Size (US$ Mn) and Volume Trend Analysis By Market Taxonomy, 2016-2020
16.3. Market Size (US$ Mn) and Volume Forecast By Market Taxonomy, 2021-2031
16.3.1. By Country
16.3.1.1. Germany
16.3.1.2. Italy
16.3.1.3. France
16.3.1.4. U.K.
16.3.1.5. Spain
16.3.1.6. BENELUX
16.3.1.7. Russia
16.3.1.8. Rest of Europe
16.3.2. By Type
16.3.3. By Chelate Type
16.3.4. By Application
16.4. Market Attractiveness Analysis
16.4.1. By Country
16.4.2. By Type
16.4.3. By Chelate Type
16.4.4. By Application
16.5. Drivers and Restraints - Impact Analysis
17. South Asia Chelated Minerals Market Analysis 2016-2020 and Forecast 2021-2031
17.1. Introduction
17.2. Historical Market Size (US$ Mn) and Volume Trend Analysis By Market Taxonomy, 2016-2020
17.3. Market Size (US$ Mn) and Volume Forecast By Market Taxonomy, 2021-2031
17.3.1. By Country
17.3.1.1. India
17.3.1.2. Thailand
17.3.1.3. Indonesia
17.3.1.4. Malaysia
17.3.1.5. Rest of South Asia
17.3.2. By Type
17.3.3. By Chelate Type
17.3.4. By Application
17.4. Market Attractiveness Analysis
17.4.1. By Country
17.4.2. By Type
17.4.3. By Chelate Type
17.4.4. By Application
17.5. Drivers and Restraints - Impact Analysis
18. East Asia Chelated Minerals Market Analysis 2016-2020 and Forecast 2021-2031
18.1. Introduction
18.2. Historical Market Size (US$ Mn) and Volume Trend Analysis By Market Taxonomy, 2016-2020
18.3. Market Size (US$ Mn) and Volume Forecast By Market Taxonomy, 2021-2031
18.3.1. By Country
18.3.1.1. China
18.3.1.2. Japan
18.3.1.3. South Korea
18.3.2. By Type
18.3.3. By Chelate Type
18.3.4. By Application
18.4. Market Attractiveness Analysis
18.4.1. By Country
18.4.2. By Type
18.4.3. By Chelate Type
18.4.4. By Application
18.5. Drivers and Restraints - Impact Analysis
18.6. Drivers and Restraints - Impact Analysis
19. Oceania Chelated Minerals Market Analysis 2016-2020 and Forecast 2021-2031
19.1. Introduction
19.2. Historical Market Size (US$ Mn) and Volume Trend Analysis By Market Taxonomy, 2016-2020
19.3. Market Size (US$ Mn) and Volume Forecast By Market Taxonomy, 2021-2031
19.3.1. By Country
19.3.1.1. Australia
19.3.1.2. New Zealand
19.3.2. By Type
19.3.3. By Chelate Type
19.3.4. By Application
19.4. Market Attractiveness Analysis
19.4.1. By Country
19.4.2. By Type
19.4.3. By Chelate Type
19.4.4. By Application
19.5. Drivers and Restraints - Impact Analysis
20. Middle East and Africa Chelated Minerals Market Analysis 2016-2020 and Forecast 2021-2031
20.1. Introduction
20.2. Historical Market Size (US$ Mn) and Volume Trend Analysis By Market Taxonomy, 2016-2020
20.3. Market Size (US$ Mn) and Volume Forecast By Market Taxonomy, 2021-2031
20.3.1. By Country
20.3.1.1. GCC Countries
20.3.1.2. South Africa
20.3.1.3. Rest of Middle East and Africa
20.3.2. By Type
20.3.3. By Chelate Type
20.3.4. By Application
20.4. Market Attractiveness Analysis
20.4.1. By Country
20.4.2. By Type
20.4.3. By Chelate Type
20.4.4. By Application
20.5. Drivers and Restraints - Impact Analysis
21. Market Structure Analysis
21.1. Market Analysis by Tier of Companies
21.2. Market Concentration
21.3. Market Presence Analysis
21.3.1. Regional footprint of Players
21.3.2. Channel Foot Print by Players
22. Competition Analysis
22.1. Competition Dashboard
22.2. Competition Benchmarking
22.3. Competition Deep Dive
22.3.1. Cargill Incorporated
22.3.1.1. Overview
22.3.1.2. Product Portfolio
22.3.1.3. Sales Footprint
22.3.1.4. Key Developments/Key Takeaways
22.3.1.5. Strategy Overview
22.3.1.6. Financial Overview
22.3.2. ADM
22.3.2.1. Overview
22.3.2.2. Product Portfolio
22.3.2.3. Sales Footprint
22.3.2.4. Key Developments/Key Takeaways
22.3.2.5. Strategy Overview
22.3.2.6. Financial Overview
22.3.3. BASF
22.3.3.1. Overview
22.3.3.2. Product Portfolio/Key Brands
22.3.3.3. Sales Footprint
22.3.3.4. Key Developments/Key Takeaways
22.3.3.5. Strategy Overview
22.3.4. Glanbia Nutritionals
22.3.4.1. Overview
22.3.4.2. Product Portfolio
22.3.4.3. Sales Footprint
22.3.4.4. Key Developments/Key Takeaways
22.3.4.5. Strategy Overview
22.3.4.6. Financial Overview
22.3.5. Balchem Inc.
22.3.5.1. Overview
22.3.5.2. Product Portfolio
22.3.5.3. Sales Footprint
22.3.5.4. Key Developments/Key Takeaways
22.3.5.5. Strategy Overview
22.3.5.6. Financial Overview
22.3.6. Virbac
22.3.6.1. Overview
22.3.6.2. Product Portfolio
22.3.6.3. Sales Footprint
22.3.6.4. Key Developments/Key Takeaways
22.3.6.5. Strategy Overview
22.3.6.6. Financial Overview
22.3.7. LMF Feeds, Inc
22.3.7.1. Overview
22.3.7.2. Product Portfolio
22.3.7.3. Sales Footprint
22.3.7.4. Key Developments/Key Takeaways
22.3.7.5. Strategy Overview
22.3.7.6. Financial Overview
22.3.8. Koninklijke DSM N.V.
22.3.8.1. Overview
22.3.8.2. Product Portfolio
22.3.8.3. Sales Footprint
22.3.8.4. Key Developments/Key Takeaways
22.3.8.5. Strategy Overview
22.3.8.6. Financial Overview
22.3.9. Nutreco
22.3.9.1. Overview
22.3.9.2. Product Portfolio
22.3.9.3. Sales Footprint
22.3.9.4. Key Developments/Key Takeaways
22.3.9.5. Strategy Overview
22.3.9.6. Financial Overview
22.3.10. DLG Group
22.3.10.1. Overview
22.3.10.2. Product Portfolio
22.3.10.3. Sales Footprint
22.3.10.4. Key Developments/Key Takeaways
22.3.10.5. Strategy Overview
22.3.10.6. Financial Overview
22.3.11. Bluestar Adisseo
22.3.11.1. Overview
22.3.11.2. Product Portfolio
22.3.11.3. Sales Footprint
22.3.11.4. Key Developments/Key Takeaways
22.3.11.5. Strategy Overview
22.3.11.6. Financial Overview
22.3.12. Alltech
22.3.12.1. Overview
22.3.12.2. Product Portfolio
22.3.12.3. Sales Footprint
22.3.12.4. Key Developments/Key Takeaways
22.3.12.5. Strategy Overview
22.3.12.6. Financial Overview
22.3.13. Phibro
22.3.13.1. Overview
22.3.13.2. Product Portfolio
22.3.13.3. Sales Footprint
22.3.13.4. Key Developments/Key Takeaways
22.3.13.5. Strategy Overview
22.3.13.6. Financial Overview
22.3.14. Kemin
22.3.14.1. Overview
22.3.14.2. Product Portfolio
22.3.14.3. Sales Footprint
22.3.14.4. Key Developments/Key Takeaways
22.3.14.5. Strategy Overview
22.3.14.6. Financial Overview
22.3.15. Zinpro
22.3.15.1. Overview
22.3.15.2. Product Portfolio
22.3.15.3. Sales Footprint
22.3.15.4. Key Developments/Key Takeaways
22.3.15.5. Strategy Overview
22.3.15.6. Financial Overview
22.3.16. Novus International
22.3.16.1. Overview
22.3.16.2. Product Portfolio
22.3.16.3. Sales Footprint
22.3.16.4. Key Developments/Key Takeaways
22.3.16.5. Strategy Overview
22.3.16.6. Financial Overview
22.3.17. Phoenix Nutrition
22.3.17.1. Overview
22.3.17.2. Product Portfolio
22.3.17.3. Sales Footprint
22.3.17.4. Key Developments/Key Takeaways
22.3.17.5. Strategy Overview
22.3.17.6. Financial Overview
22.3.18. Prathista Industries Limited
22.3.18.1. Overview
22.3.18.2. Product Portfolio
22.3.18.3. Sales Footprint
22.3.18.4. Key Developments/Key Takeaways
22.3.18.5. Strategy Overview
22.3.18.6. Financial Overview
22.3.19. Lehmann&Voss&Co.
22.3.19.1. Overview
22.3.19.2. Product Portfolio
22.3.19.3. Sales Footprint
22.3.19.4. Key Developments/Key Takeaways
22.3.19.5. Strategy Overview
22.3.19.6. Financial Overview
22.3.20. Jost Chemical Co
22.3.20.1. Overview
22.3.20.2. Product Portfolio
22.3.20.3. Sales Footprint
22.3.20.4. Key Developments/Key Takeaways
22.3.20.5. Strategy Overview
22.3.20.6. Financial Overview
22.3.21. NOW Foods
22.3.21.1. Overview
22.3.21.2. Product Portfolio
22.3.21.3. Sales Footprint
22.3.21.4. Key Developments/Key Takeaways
22.3.21.5. Strategy Overview
22.3.21.6. Financial Overview
22.3.22. Others
23. Assumptions and Acronyms Used
24. Research Methodology
List of Tables
Table 01: Global Chelated Minerals Market Value (US$ Mn) Analysis and Forecast by Type, 2016-2031
Table 02: Global Chelated Minerals Market Volume (Tons) Analysis and Forecast by Type, 2016-2031
Table 03: Global Chelated Minerals Market Value (US$ Mn) Analysis and Forecast by Chelate Type, 2016-2031
Table 04: Global Chelated Minerals Market Volume (Tons) Analysis and Forecast by Chelate Type, 2016-2031
Table 05: Global Chelated Minerals Market Value (US$ Mn) Analysis and Forecast by Application, 2016-2031
Table 06: Global Chelated Minerals Market Volume (Tons) Analysis and Forecast by Application, 2016-2031
Table 07: Global Chelated Minerals Market Value (US$ Mn) Analysis and Forecast by Animal Feed, 2016-2031
Table 08: Global Chelated Minerals Market Volume (Tons) Analysis and Forecast by Animal Feed, 2016-2031
Table 09: Global Chelated Minerals Market Value (US$ Mn) Analysis and Forecast by Region, 2016-2031
Table 10: Global Chelated Minerals Market Volume (Tons) Analysis and Forecast by Region, 2016-2031
Table 11: North America Chelated Minerals Market Value (US$ Mn) Analysis and Forecast by Type, 2016-2031
Table 12: North America Chelated Minerals Market Volume (Tons) Analysis and Forecast by Type, 2016-2031
Table 13: North America Chelated Minerals Market Value (US$ Mn) Analysis and Forecast by Chelate Type, 2016-2031
Table 14: North America Chelated Minerals Market Volume (Tons) Analysis and Forecast by Chelate Type, 2016-2031
Table 15: North America Chelated Minerals Market Value (US$ Mn) Analysis and Forecast by Application, 2016-2031
Table 16: North America Chelated Minerals Market Volume (Tons) Analysis and Forecast by Application, 2016-2031
Table 17: North America Chelated Minerals Market Value (US$ Mn) Analysis and Forecast by Animal Feed, 2016-2031
Table 18: North America Chelated Minerals Market Volume (Tons) Analysis and Forecast by Animal Feed, 2016-2031
Table 19: North America Chelated Minerals Market Value (US$ Mn) Analysis and Forecast by Country, 2016–2031
Table 20: North America Chelated Minerals Market Volume (Tons) Analysis and Forecast by Country, 2016–2031
Table 21: U.S. Chelated Minerals Market Value (US$ Mn) Analysis and Forecast by Type, 2016-2031
Table 22: U.S. Chelated Minerals Market Volume (Tons) Analysis and Forecast by Type, 2016-2031
Table 23: U.S. Chelated Minerals Market Value (US$ Mn) Analysis and Forecast by Chelate Type, 2016-2031
Table 24: U.S. Chelated Minerals Market Volume (Tons) Analysis and Forecast by Chelate Type, 2016-2031
Table 25: U.S. Chelated Minerals Market Value (US$ Mn) Analysis and Forecast by Application, 2016-2031
Table 26: U.S. Chelated Minerals Market Volume (Tons) Analysis and Forecast by Application, 2016-2031
Table 27: U.S. Chelated Minerals Market Value (US$ Mn) Analysis and Forecast by Animal Feed, 2016-2031
Table 28: U.S. Chelated Minerals Market Volume (Tons) Analysis and Forecast by Animal Feed, 2016-2031
Table 29: Latin America Chelated Minerals Market Value (US$ Mn) Analysis and Forecast by Type, 2016-2031
Table 30: Latin America Chelated Minerals Market Volume (Tons) Analysis and Forecast by Type, 2016-2031
Table 31: Latin America Chelated Minerals Market Value (US$ Mn) Analysis and Forecast by Chelate Type, 2016-2031
Table 32: Latin America Chelated Minerals Market Volume (Tons) Analysis and Forecast by Chelate Type, 2016-2031
Table 33: Latin America Chelated Minerals Market Value (US$ Mn) Analysis and Forecast by Application, 2016-2031
Table 34: Latin America Chelated Minerals Market Volume (Tons) Analysis and Forecast by Application, 2016-2031
Table 35: Latin America Chelated Minerals Market Value (US$ Mn) Analysis and Forecast by Animal Feed, 2016-2031
Table 36: Latin America Chelated Minerals Market Volume (Tons) Analysis and Forecast by Animal Feed, 2016-2031
Table 37: Latin America Chelated Minerals Market Value (US$ Mn) Analysis and Forecast by Country, 2016–2031
Table 38: Latin America Chelated Minerals Market Volume (Tons) Analysis and Forecast by Country, 2016–2031
Table 39: Europe Chelated Minerals Market Value (US$ Mn) Analysis and Forecast by Type, 2016-2031
Table 40: Europe Chelated Minerals Market Volume (Tons) Analysis and Forecast by Type, 2016-2031
Table 41: Europe Chelated Minerals Market Value (US$ Mn) Analysis and Forecast by Chelate Type, 2016-2031
Table 42: Europe Chelated Minerals Market Volume (Tons) Analysis and Forecast by Chelate Type, 2016-2031
Table 43: Europe Chelated Minerals Market Value (US$ Mn) Analysis and Forecast by Application, 2016-2031
Table 44: Europe Chelated Minerals Market Volume (Tons) Analysis and Forecast by Application, 2016-2031
Table 45: Europe Chelated Minerals Market Value (US$ Mn) Analysis and Forecast by Animal Feed, 2016-2031
Table 46: Europe Chelated Minerals Market Volume (Tons) Analysis and Forecast by Animal Feed, 2016-2031
Table 47: Europe Chelated Minerals Market Value (US$ Mn) Analysis and Forecast by Country, 2015–2030
Table 48: Europe Chelated Minerals Market Volume (Tons) Analysis and Forecast by Country, 2015–2030
Table 49: South Asia Chelated Minerals Market Value (US$ Mn) Analysis and Forecast by Type, 2016-2031
Table 50: South Asia Chelated Minerals Market Volume (Tons) Analysis and Forecast by Type, 2016-2031
Table 51: South Asia Chelated Minerals Market Value (US$ Mn) Analysis and Forecast by Chelate Type, 2016-2031
Table 52: South Asia Chelated Minerals Market Volume (Tons) Analysis and Forecast by Chelate Type, 2016-2031
Table 53: South Asia Chelated Minerals Market Value (US$ Mn) Analysis and Forecast by Application, 2016-2031
Table 54: South Asia Chelated Minerals Market Volume (Tons) Analysis and Forecast by Application, 2016-2031
Table 55: South Asia Chelated Minerals Market Value (US$ Mn) Analysis and Forecast by Animal Feed, 2016-2031
Table 56: South Asia Chelated Minerals Market Volume (Tons) Analysis and Forecast by Animal Feed, 2016-2031
Table 57: South Asia Chelated Minerals Market Value (US$ Mn) Analysis and Forecast by Country, 2015–2030
Table 58: South Asia Chelated Minerals Market Volume (Tons) Analysis and Forecast by Country, 2015–2030
Table 59: East Asia Chelated Minerals Market Value (US$ Mn) Analysis and Forecast by Type, 2016-2031
Table 60: East Asia Chelated Minerals Market Volume (Tons) Analysis and Forecast by Type, 2016-2031
Table 61: East Asia Chelated Minerals Market Value (US$ Mn) Analysis and Forecast by Chelate Type, 2016-2031
Table 62: East Asia Chelated Minerals Market Volume (Tons) Analysis and Forecast by Chelate Type, 2016-2031
Table 63: East Asia Chelated Minerals Market Value (US$ Mn) Analysis and Forecast by Application, 2016-2031
Table 64: East Asia Chelated Minerals Market Volume (Tons) Analysis and Forecast by Application, 2016-2031
Table 65: East Asia Chelated Minerals Market Value (US$ Mn) Analysis and Forecast by Animal Feed, 2016-2031
Table 66: East Asia Chelated Minerals Market Volume (Tons) Analysis and Forecast by Animal Feed, 2016-2031
Table 67: East Asia Chelated Minerals Market Value (US$ Mn) Analysis and Forecast by Country, 2015–2030
Table 68: East Asia Chelated Minerals Market Volume (Tons) Analysis and Forecast by Country, 2015–2030
Table 69: Oceania Chelated Minerals Market Value (US$ Mn) Analysis and Forecast by Type, 2016-2031
Table 70: Oceania Chelated Minerals Market Volume (Tons) Analysis and Forecast by Type, 2016-2031
Table 71: Oceania Chelated Minerals Market Value (US$ Mn) Analysis and Forecast by Chelate Type, 2016-2031
Table 72: Oceania Chelated Minerals Market Volume (Tons) Analysis and Forecast by Chelate Type, 2016-2031
Table 73: Oceania Chelated Minerals Market Value (US$ Mn) Analysis and Forecast by Application, 2016-2031
Table 74: Oceania Chelated Minerals Market Volume (Tons) Analysis and Forecast by Application, 2016-2031
Table 75: Oceania Chelated Minerals Market Value (US$ Mn) Analysis and Forecast by Animal Feed, 2016-2031
Table 76: Oceania Chelated Minerals Market Volume (Tons) Analysis and Forecast by Animal Feed, 2016-2031
Table 77: Oceania Chelated Minerals Market Value (US$ Mn) Analysis and Forecast by Country, 2015–2030
Table 78: Oceania Chelated Minerals Market Volume (Tons) Analysis and Forecast by Country, 2015–2030
Table 79: Middle East & Africa Chelated Minerals Market Value (US$ Mn) Analysis and Forecast by Type, 2016-2031
Table 80: Middle East & Africa Chelated Minerals Market Volume (Tons) Analysis and Forecast by Type, 2016-2031
Table 81: Middle East & Africa Chelated Minerals Market Value (US$ Mn) Analysis and Forecast by Chelate Type, 2016-2031
Table 82: Middle East & Africa Chelated Minerals Market Volume (Tons) Analysis and Forecast by Chelate Type, 2016-2031
Table 83: Middle East & Africa Chelated Minerals Market Value (US$ Mn) Analysis and Forecast by Application, 2016-2031
Table 84: Middle East & Africa Chelated Minerals Market Volume (Tons) Analysis and Forecast by Application, 2016-2031
Table 85: Middle East & Africa Chelated Minerals Market Value (US$ Mn) Analysis and Forecast by Animal Feed, 2016-2031
Table 86: Middle East & Africa Chelated Minerals Market Volume (Tons) Analysis and Forecast by Animal Feed, 2016-2031
Table 87: Middle East & Africa Chelated Minerals Market Value (US$ Mn) Analysis and Forecast by Country, 2015–2030
Table 88: Middle East & Africa Chelated Minerals Market Volume (Tons) Analysis and Forecast by Country, 2015–2030
List of Figures
Figure 01: Global Chelated Minerals Market Value (US$ Mn) Forecast, 2021–2031
Figure 02: Global Chelated Minerals Market Volume (Tons) Forecast, 2021–2031
Figure 03: Global Chelated Minerals Market Value Share Analysis by Type, 2021 E
Figure 04: Global Chelated Minerals Market Y-o-Y Growth Rate by Type, 2021-2031
Figure 05: Global Chelated Minerals Market Value (US$ Mn) Analysis & Forecast by Type, 2021–2031
Figure 06: Global Chelated Minerals Market Volume (Tons) Analysis & Forecast by Type, 2021–2031
Figure 07: Global Chelated Minerals Market Value Share Analysis by Chelate Type, 2021 E
Figure 08: Global Chelated Minerals Market Y-o-Y Growth Rate by Chelate Type, 2021-2031
Figure 09: Global Chelated Minerals Market Value (US$ Mn) Analysis & Forecast by Chelate Type, 2021–2031
Figure 10: Global Chelated Minerals Market Volume (Tons) Analysis & Forecast by Chelate Type, 2021–2031
Figure 11: Global Chelated Minerals Market Value Share Analysis by Application, 2021 E
Figure 12: Global Chelated Minerals Market Y-o-Y Growth Rate by Application, 2021-2031
Figure 13: Global Chelated Minerals Market Value (US$ Mn) Analysis & Forecast by Application, 2021–2031
Figure 14: Global Chelated Minerals Market Volume (Tons) Analysis & Forecast by Application, 2021–2031
Figure 15: Global Chelated Minerals Market Value Share Analysis by Region, 2021 E
Figure 16: Global Chelated Minerals Market Y-o-Y Growth Rate by Region, 2021-2031
Figure 17: Global Chelated Minerals Market Value (US$ Mn) Analysis & Forecast by Region, 2021–2031
Figure 18: Global Chelated Minerals Market Volume (Tons) Analysis & Forecast by Region, 2021–2031
Figure 19: Global Chelated Minerals Market Attractiveness Analysis by Region, 2021-2031
Figure 20: Global Chelated Minerals Market Attractiveness Analysis by Type, 2021-2031
Figure 21: Global Chelated Minerals Market Attractiveness Analysis by Chelate Type, 2021-2031
Figure 22: Global Chelated Minerals Market Attractiveness Analysis by Application, 2021-2031
Figure 23: North America Chelated Minerals Market Value (US$ Mn) Analysis & Forecast by Type, 2021–2031
Figure 24: North America Chelated Minerals Market Volume (Tons) Analysis & Forecast by Type, 2021–2031
Figure 25: North America Chelated Minerals Market Value (US$ Mn) Analysis & Forecast by Chelate Type, 2021–2031
Figure 26: North America Chelated Minerals Market Volume (Tons) Analysis & Forecast by Chelate Type, 2021–2031
Figure 27: North America Chelated Minerals Market Value (US$ Mn) Analysis & Forecast by Application, 2021–2031
Figure 28: North America Chelated Minerals Market Volume (Tons) Analysis & Forecast by Application, 2021–2031
Figure 29: North America Chelated Minerals Market Value (US$ Mn) Analysis & Forecast by Country, 2021–2031
Figure 30: North America Chelated Minerals Market Volume (Tons) Analysis & Forecast by Country, 2021–2031
Figure 31: North America Chelated Minerals Market Attractiveness Analysis by Country, 2021-2031
Figure 32: North America Chelated Minerals Market Attractiveness Analysis by Type, 2021-2031
Figure 33: North America Chelated Minerals Market Attractiveness Analysis by Chelate Type, 2021-2031
Figure 34: North America Chelated Minerals Market Attractiveness Analysis by Application, 2021-2031
Figure 35: U.S. Chelated Minerals Market Value (US$ Mn) Analysis & Forecast by Type, 2021–2031
Figure 36: U.S. Chelated Minerals Market Volume (Tons) Analysis & Forecast by Type, 2021–2031
Figure 37: U.S. Chelated Minerals Market Value (US$ Mn) Analysis & Forecast by Chelate Type, 2021–2031
Figure 38: U.S. Chelated Minerals Market Volume (Tons) Analysis & Forecast by Chelate Type, 2021–2031
Figure 39: U.S. Chelated Minerals Market Value (US$ Mn) Analysis & Forecast by Application, 2021–2031
Figure 40: U.S. Chelated Minerals Market Volume (Tons) Analysis & Forecast by Application, 2021–2031
Figure 41: U.S. Chelated Minerals Market Attractiveness Analysis by Type, 2021-2031
Figure 42: U.S. Chelated Minerals Market Attractiveness Analysis by Chelate Type, 2021-2031
Figure 43: U.S. Chelated Minerals Market Attractiveness Analysis by Application, 2021-2031
Figure 44: Latin America Chelated Minerals Market Value (US$ Mn) Analysis & Forecast by Type, 2021–2031
Figure 45: Latin America Chelated Minerals Market Volume (Tons) Analysis & Forecast by Type, 2021–2031
Figure 46: Latin America Chelated Minerals Market Value (US$ Mn) Analysis & Forecast by Chelate Type, 2021–2031
Figure 47: Latin America Chelated Minerals Market Volume (Tons) Analysis & Forecast by Chelate Type, 2021–2031
Figure 48: Latin America Chelated Minerals Market Value (US$ Mn) Analysis & Forecast by Application, 2021–2031
Figure 49: Latin America Chelated Minerals Market Volume (Tons) Analysis & Forecast by Application, 2021–2031
Figure 50: Latin America Chelated Minerals Market Value (US$ Mn) Analysis & Forecast by Country, 2021–2031
Figure 51: Latin America Chelated Minerals Market Volume (Tons) Analysis & Forecast by Country, 2021–2031
Figure 52: Latin America Chelated Minerals Market Attractiveness Analysis by Country, 2021-2031
Figure 53: Latin America Chelated Minerals Market Attractiveness Analysis by Type, 2021-2031
Figure 54: Latin America Chelated Minerals Market Attractiveness Analysis by Chelate Type, 2021-2031
Figure 55: Latin America Chelated Minerals Market Attractiveness Analysis by Application, 2021-2031
Figure 56: Europe Chelated Minerals Market Value (US$ Mn) Analysis & Forecast by Type, 2021–2031
Figure 57: Europe Chelated Minerals Market Volume (Tons) Analysis & Forecast by Type, 2021–2031
Figure 58: Europe Chelated Minerals Market Value (US$ Mn) Analysis & Forecast by Chelate Type, 2021–2031
Figure 59: Europe Chelated Minerals Market Volume (Tons) Analysis & Forecast by Chelate Type, 2021–2031
Figure 60: Europe Chelated Minerals Market Value (US$ Mn) Analysis & Forecast by Application, 2021–2031
Figure 61: Europe Chelated Minerals Market Volume (Tons) Analysis & Forecast by Application, 2021–2031
Figure 62: Europe Chelated Minerals Market Value (US$ Mn) Analysis & Forecast by Country, 2021–2031
Figure 63: Europe Chelated Minerals Market Volume (Tons) Analysis & Forecast by Country, 2021–2031
Figure 64: Europe Chelated Minerals Market Attractiveness Analysis by Country, 2021-2031
Figure 65: Europe Chelated Minerals Market Attractiveness Analysis by Type, 2021-2031
Figure 66: Europe Chelated Minerals Market Attractiveness Analysis by Chelate Type, 2021-2031
Figure 67: Europe Chelated Minerals Market Attractiveness Analysis by Application, 2021-2031
Figure 68: South Asia Chelated Minerals Market Value (US$ Mn) Analysis & Forecast by Type, 2021–2031
Figure 69: South Asia Chelated Minerals Market Volume (Tons) Analysis & Forecast by Type, 2021–2031
Figure 70: South Asia Chelated Minerals Market Value (US$ Mn) Analysis & Forecast by Chelate Type, 2021–2031
Figure 71: South Asia Chelated Minerals Market Volume (Tons) Analysis & Forecast by Chelate Type, 2021–2031
Figure 72: South Asia Chelated Minerals Market Value (US$ Mn) Analysis & Forecast by Application, 2021–2031
Figure 73: South Asia Chelated Minerals Market Volume (Tons) Analysis & Forecast by Application, 2021–2031
Figure 74: South Asia Chelated Minerals Market Value (US$ Mn) Analysis & Forecast by Country, 2021–2031
Figure 75: South Asia Chelated Minerals Market Volume (Tons) Analysis & Forecast by Country, 2021–2031
Figure 76: South Asia Chelated Minerals Market Attractiveness Analysis by Country, 2021-2031
Figure 77: South Asia Chelated Minerals Market Attractiveness Analysis by Type, 2021-2031
Figure 78: South Asia Chelated Minerals Market Attractiveness Analysis by Chelate Type, 2021-2031
Figure 79: South Asia Chelated Minerals Market Attractiveness Analysis by Application, 2021-2031
Figure 80: East Asia Chelated Minerals Market Value (US$ Mn) Analysis & Forecast by Type, 2021–2031
Figure 81: East Asia Chelated Minerals Market Volume (Tons) Analysis & Forecast by Type, 2021–2031
Figure 82: East Asia Chelated Minerals Market Value (US$ Mn) Analysis & Forecast by Chelate Type, 2021–2031
Figure 83: East Asia Chelated Minerals Market Volume (Tons) Analysis & Forecast by Chelate Type, 2021–2031
Figure 84: East Asia Chelated Minerals Market Value (US$ Mn) Analysis & Forecast by Application, 2021–2031
Figure 85: East Asia Chelated Minerals Market Volume (Tons) Analysis & Forecast by Application, 2021–2031
Figure 86: East Asia Chelated Minerals Market Value (US$ Mn) Analysis & Forecast by Country, 2021–2031
Figure 87: East Asia Chelated Minerals Market Volume (Tons) Analysis & Forecast by Country, 2021–2031
Figure 88: East Asia Chelated Minerals Market Attractiveness Analysis by Country, 2021-2031
Figure 89: East Asia Chelated Minerals Market Attractiveness Analysis by Type, 2021-2031
Figure 90: East Asia Chelated Minerals Market Attractiveness Analysis by Chelate Type, 2021-2031
Figure 91: East Asia Chelated Minerals Market Attractiveness Analysis by Application, 2021-2031
Figure 92: Oceania Chelated Minerals Market Value (US$ Mn) Analysis & Forecast by Type, 2021–2031
Figure 93: Oceania Chelated Minerals Market Volume (Tons) Analysis & Forecast by Type, 2021–2031
Figure 94: Oceania Chelated Minerals Market Value (US$ Mn) Analysis & Forecast by Chelate Type, 2021–2031
Figure 95: Oceania Chelated Minerals Market Volume (Tons) Analysis & Forecast by Chelate Type, 2021–2031
Figure 96: Oceania Chelated Minerals Market Value (US$ Mn) Analysis & Forecast by Application, 2021–2031
Figure 97: Oceania Chelated Minerals Market Volume (Tons) Analysis & Forecast by Application, 2021–2031
Figure 98: Oceania Chelated Minerals Market Value (US$ Mn) Analysis & Forecast by Country, 2021–2031
Figure 99: Oceania Chelated Minerals Market Volume (Tons) Analysis & Forecast by Country, 2021–2031
Figure 100: Oceania Chelated Minerals Market Attractiveness Analysis by Country, 2021-2031
Figure 101: Oceania Chelated Minerals Market Attractiveness Analysis by Type, 2021-2031
Figure 102: Oceania Chelated Minerals Market Attractiveness Analysis by Chelate Type, 2021-2031
Figure 103: Oceania Chelated Minerals Market Attractiveness Analysis by Application, 2021-2031
Figure 104: Middle East & Africa Chelated Minerals Market Value (US$ Mn) Analysis & Forecast by Type, 2021–2031
Figure 105: Middle East & Africa Chelated Minerals Market Volume (Tons) Analysis & Forecast by Type, 2021–2031
Figure 106: Middle East & Africa Chelated Minerals Market Value (US$ Mn) Analysis & Forecast by Chelate Type, 2021–2031
Figure 107: Middle East & Africa Chelated Minerals Market Volume (Tons) Analysis & Forecast by Chelate Type, 2021–2031
Figure 108: Middle East & Africa Chelated Minerals Market Value (US$ Mn) Analysis & Forecast by Application, 2021–2031
Figure 109: Middle East & Africa Chelated Minerals Market Volume (Tons) Analysis & Forecast by Application, 2021–2031
Figure 110: Middle East & Africa Chelated Minerals Market Value (US$ Mn) Analysis & Forecast by Country, 2021–2031
Figure 111: Middle East & Africa Chelated Minerals Market Volume (Tons) Analysis & Forecast by Country, 2021–2031
Figure 112: Middle East & Africa Chelated Minerals Market Attractiveness Analysis by Country, 2021-2031
Figure 113: Middle East & Africa Chelated Minerals Market Attractiveness Analysis by Type, 2021-2031
Figure 114: Middle East & Africa Chelated Minerals Market Attractiveness Analysis by Chelate Type, 2021-2031
Figure 115: Middle East & Africa Chelated Minerals Market Attractiveness Analysis by Application, 2021-2031
Copyright © Transparency Market Research, Inc. All Rights reserved
Trust Online

Chelated Minerals Market
