Analysts’ Viewpoint on Brewery Equipment Market Scenario
Rise in consumption of beer; increase in demand for brewing equipment from industrial breweries and small businesses; and growth of brewpubs and beer-producing companies are the major factors driving the global brewery equipment market. Companies operating in the brewery equipment market are focusing on customization, design, and automation. Manufacturers should tap into incremental opportunities by focusing on recent trends in the market in order to broaden their revenue streams. Volatility in prices of raw materials such as steel, copper, and aluminum have impacted the margins of manufacturers. Nevertheless, companies need to invest in technologies that can help make better and unique beer.
Brewery equipment refers to various units or equipment used in brewery processing or beer-making companies such as brewpubs and craft breweries. The term ‘brewery’ refers to the process or business of producing beer. Demand for different categories of customized and automated brewery equipment, including micro and macro/industrial breweries, is rising among end-users. Companies in the brewery equipment market are manufacturing equipment using technologies that can enhance efficiency and reduce energy consumption. Innovations in home beer brewing machines, microbrewery equipment, electric brewing systems, home beer brewing kits, and automated brewing systems are creating significant opportunities for market players.
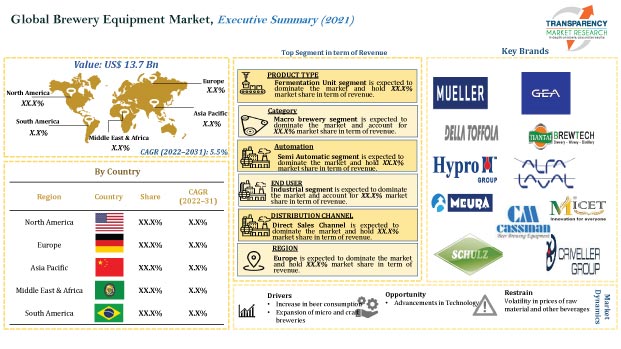
The global brewery equipment market size is estimated to reach a value of US$ 23.3 Bn by the end of 2031, owing to the significant demand from commercial and industrial end-users. Rise in demand for different types of equipment owing to the increase in number of brewpubs and restaurants is also boosting the demand for home brewing equipment and commercial beer brewing equipment. Beer is one of the favorite and most consumed alcoholic beverages around the world. Rise in population in emerging countries and increase in consumption of beer among the millennials are augmenting the brewery industry. This, in turn, is estimated to propel the demand for brewery equipment during the forecast period.
Asia Pacific leads in terms of consumption of beer, while Europe follows the region. China consumes 21.5% of the total beer produced globally, while the U.S. consumes 12.8%. Consumption of beer in Germany Russia, Japan, and the U.K is also high. According to the Brewers Association, the overall U.S. beer volume sales increased by 1% in 2021. In the U.K., a 2.6% increase was witnessed; 2018 recorded the highest consumption in the U.K., in terms of volume, in the last 45 years. This is expected to propel the brewery equipment market during the forecast period.
Microbreweries and brewpubs strengthen the bond with consumers and enhance the loyalty factor by providing an open and friendly atmosphere. According to the Brewers Association, sales of craft beer in the U.S. increased by 8% in terms of volume in 2021, thereby boosting the share held by small and independent brewers in the U.S. beer market to 13.1%. The primary reason for the larger dollar sales increase was the shift back in beer volume from packaged sales to bars and restaurants. Asia Pacific, Europe, and North America are projected to be emerging markets for brewery equipment across the globe. This is anticipated to drive the demand for brewery equipment in these regions during the forecast period.
Out of 9,247 breweries in the U.S., microbreweries and brewpubs accounted for more than 56% share in 2021. Growth of microbreweries and brewpubs has also continued in countries across Europe, especially among smaller craft brewers who produce less than 30,000 barrels. Moreover, microbreweries account for nearly two-thirds of the craft category’s total growth, while sales at brewpubs are also rising. Thus, overall growth of the breweries market is expected to propel the brewery equipment market during the forecast period.
In terms of product type, the fermentation unit segment is estimated to hold major share of the brewery equipment market during the forecast period. The fermentation unit segment is likely to grow at a prominent CAGR owing to the rise in usage of fermentation tanks for a longer period during the brewing process. After the brewing and mashing process, the wort is kept in the fermentation tank for a long period for the fermentation process. The chances of tank deterioration increase due to the release of acid. This is projected to drive the need for fermenters and consequently boost the fermentation tank segment during the forecast period. Additionally, advancement of technology in equipment and customization of equipment are expected to fuel the fermentation unit segment during the forecast period.
In terms of end-use industry, the global brewery equipment market has been bifurcated into commercial and industrial. The commercial end-use industry segment includes pubs, bars, restaurants, and hotels. Demand for commercial brewing equipment is rising across the globe. The commercial segment is estimated to grow at a notable CAGR during the forecast period owing to the increase in population, standard of living, and the number of pubs, bars, etc. The industrial segment includes large manufacturers of beer. The industrial segment held major share of the brewery equipment market in 2021.
Europe is projected to hold major share of the global brewery equipment market during the forecast period. This can be ascribed to the rise in consumption and production of beer in Europe and growth of the beer industry in the region. Europe is home to around 10,000 breweries, and the region follows Asia Pacific in terms of consumption of beer. In terms of country, the U.S. is a major market for brewery equipment. The U.S. is home to around 9964 breweries. Additionally, after China, the U.S. is a major consumer and producer of beer.
The global brewery equipment market is fragmented, with the presence of numerous players. Competition is expected to intensify in the next few years due to the entry of several local players. Manufacturers in the brewery equipment market are also focusing on the advancement of technology and entering into partnerships with small businesses such as pubs, craft breweries, and industrial breweries (large beer manufacturers). Several brewery equipment suppliers are focusing on catering to the demands of customers according to the latest trends of customization in products. Key players operating in the global brewery equipment market include Alfa Laval, Brewtech, Tiantai, Criveller Group, Della Toffola, GEA Group, Hypro Group, Jinan Cassman Machinery Co., Ltd., Kaspar Schulz, Meura, Micet, and Paul Mueller.
Each of these players has been profiled in the brewery equipment market report based on parameters such as company overview, financial overview, business strategies, product portfolio, business segments, and recent developments.
|
Attribute |
Detail |
|
Market Size Value in 2021 |
US$ 13.7 Bn |
|
Market Forecast Value in 2031 |
US$ 23.3 Bn |
|
Growth Rate (CAGR) |
5.5% |
|
Forecast Period |
2022–2031 |
|
Historical Data Available for |
2017–2020 |
|
Quantitative Units |
US$ Bn for Value & Million Units for Volume |
|
Market Analysis |
Global qualitative analysis includes drivers, restraints, opportunities, key trends, upcoming key trends, Technology Overview, Standard and Regulations, Porter’s Five Forces analysis, value chain analysis, SWOT analysis, etc. Furthermore, at the regional level, qualitative analysis includes key trends, price trends, Macro-Economic factors and key supplier analysis. |
|
Competition Landscape |
|
|
Format |
Electronic (PDF) + Excel |
|
Market Segmentation |
|
|
Regions Covered |
|
|
Countries Covered |
|
|
Companies Profiled |
|
|
Customization Scope |
Available upon request |
|
Pricing |
Available upon request |
The brewery equipment market stood at US$ 13.7 Bn in 2021
The brewery equipment market is expected to reach US$ 23.3 Bn by 2031
The brewery equipment market is estimated to grow at a CAGR of 5.5% by 2031
Rise in consumption of beer and growth of the brewery industry are key factors boosting the brewery equipment market
The fermentation unit segment accounted for 42.38% share of the brewery equipment market in 2021
Europe is a more attractive region for vendors in the brewery equipment market
Alfa Laval, Brewtech, Tiantai, Criveller Group, Della Toffola, GEA Group, Hypro Group, Jinan Cassman Machinery Co., Ltd., Kaspar Schulz, Meura, Micet, and Paul Mueller.
1. Preface
1.1. Market Definition and Scope
1.2. Market Segmentation
1.3. Key Research Objectives
1.4. Research Highlights
2. Assumptions
3. Research Methodology
4. Executive Summary
5. Market Overview
5.1. Introduction
5.2. Market Dynamics
5.2.1. Drivers
5.2.2. Restraints
5.2.3. Opportunities
5.3. Key Trends Analysis
5.3.1. Demand Side Analysis
5.3.2. Supply Side Analysis
5.4. Key Market Indicators
5.4.1. Overall Brewery Industry Overview
5.5. Porter’s Five Forces Analysis
5.6. Value Chain Analysis
5.7. Industry SWOT Analysis
5.8. Technology Overview
5.9. Standard and Regulations
5.10. Covid-19 Impact Analysis
5.11. Global Brewery Equipment Market Analysis and Forecast, 2017‒2031
5.11.1. Market Value Projections (US$ Bn)
5.11.2. Market Volume Projections (Million Units)
6. Global Brewery Equipment Market Analysis and Forecast, by Product Type
6.1. Global Brewery Equipment Market Size (US$ Bn and Million Units), by Product Type, 2017‒2031
6.1.1. Fermentation Unit
6.1.2. BrewHouse Unit
6.1.3. Filtration System
6.1.4. Maturation Unit
6.1.5. Others
6.2. Incremental Opportunity, by Product Type
7. Global Brewery Equipment Market Analysis and Forecast, by Category
7.1. Global Brewery Equipment Market Size (US$ Bn and Million Units), by Category, 2017‒2031
7.1.1. Nano/Micro Brewery
7.1.2. Macro /Industrial Brewery
7.2. Incremental Opportunity, by Category
8. Global Brewery Equipment Market Analysis and Forecast, by Automation
8.1. Global Brewery Equipment Market Size (US$ Bn and Million Units), by Automation, 2017‒2031
8.1.1. Manual
8.1.2. Automatic
8.1.3. Semi-Automatic
8.2. Incremental Opportunity, by Automation
9. Global Brewery Equipment Market Analysis and Forecast, by Distribution Channel
9.1. Global Brewery Equipment Market Size (US$ Bn and Million Units), by Distribution Channel, 2017‒2031
9.1.1. Direct Sales
9.1.2. Indirect Sales
9.2. Incremental Opportunity, by Distribution Channel
10. Global Brewery Equipment Market Analysis and Forecast, Region
10.1. Global Brewery Equipment Market Size (US$ Bn and Million Units), by Region, 2017‒2031
10.1.1. North America
10.1.2. Europe
10.1.3. Asia Pacific
10.1.4. Middle East & Africa
10.1.5. South America
10.2. Incremental Opportunity, by Region
11. North America Brewery Equipment Market Analysis and Forecast
11.1. Regional Snapshot
11.2. Key Trends Analysis
11.3. Macro-Economic Factors
11.4. Key Supplier Analysis
11.5. Price Trend Analysis
11.5.1. Weighted Average Selling Price (US$)
11.6. Brewery Equipment Market Size (US$ Bn and Million Units), by Product Type, 2017‒2031
11.6.1. Fermentation Unit
11.6.2. BrewHouse Unit
11.6.3. Filtration System
11.6.4. Maturation Unit
11.6.5. Others
11.7. Brewery Equipment Market Size (US$ Bn and Million Units), by Category, 2017‒2031
11.7.1. Nano/Micro Brewery
11.7.2. Macro /industrial Brewery
11.8. Brewery Equipment Market Size (US$ Bn and Million Units), by Automation, 2017‒2031
11.8.1. Manual
11.8.2. Automatic
11.8.3. Semi-Automatic
11.9. Brewery Equipment Market Size (US$ Bn and Million Units), by End-user, 2017‒2031
11.9.1. Commercial
11.9.2. Industrial
11.10. Brewery Equipment Market Size (US$ Bn and Million Units), by Distribution Channel, 2017‒2031
11.10.1. Direct Sales
11.10.2. Indirect Sales
11.11. Brewery Equipment Market Size (US$ Bn and Million Units), by Country & Sub-region, 2017‒2031
11.11.1. U.S.
11.11.2. Canada
11.11.3. Rest of North America
11.12. Incremental Opportunity Analysis
12. Europe Brewery Equipment Market Analysis and Forecast
12.1. Regional Snapshot
12.2. Key Trends Analysis
12.3. Macro-Economic Factors
12.4. Key Supplier Analysis
12.5. Price Trend Analysis
12.5.1. Weighted Average Selling Price (US$)
12.6. Brewery Equipment Market Size (US$ Bn and Million Units), by Product Type, 2017‒2031
12.6.1. Fermentation Unit
12.6.2. BrewHouse Unit
12.6.3. Filtration System
12.6.4. Maturation Unit
12.6.5. Others
12.7. Brewery Equipment Market Size (US$ Bn and Million Units), by Category, 2017‒2031
12.7.1. Nano/Micro Brewery
12.7.2. Macro /industrial Brewery
12.8. Brewery Equipment Market Size (US$ Bn and Million Units), by Automation, 2017‒2031
12.8.1. Manual
12.8.2. Automatic
12.8.3. Semi-Automatic
12.9. Brewery Equipment Market Size (US$ Bn and Million Units), by End-user, 2017‒2031
12.9.1. Commercial
12.9.2. Industrial
12.10. Brewery Equipment Market Size (US$ Bn and Million Units), by Distribution Channel, 2017‒2031
12.10.1. Direct Sales
12.10.2. Indirect Sales
12.11. Brewery Equipment Market Size (US$ Bn and Million Units), by Country & Sub-region, 2017‒2031
12.11.1. U.K.
12.11.2. Germany
12.11.3. France
12.11.4. Rest of Europe
12.12. Incremental Opportunity Analysis
13. Asia Pacific Brewery Equipment Market Analysis and Forecast
13.1. Regional Snapshot
13.2. Key Trends Analysis
13.3. Macro-Economic Factors
13.4. Key Supplier Analysis
13.5. Price Trend Analysis
13.5.1. Weighted Average Selling Price (US$)
13.6. Brewery Equipment Market Size (US$ Bn and Million Units), by Product Type, 2017‒2031
13.6.1. Fermentation Unit
13.6.2. BrewHouse Unit
13.6.3. Filtration System
13.6.4. Maturation Unit
13.6.5. Others
13.7. Brewery Equipment Market Size (US$ Bn and Million Units), by Category, 2017‒2031
13.7.1. Nano/Micro Brewery
13.7.2. Macro /industrial Brewery
13.8. Brewery Equipment Market Size (US$ Bn and Million Units), by Automation, 2017‒2031
13.8.1. Manual
13.8.2. Automatic
13.8.3. Semi-Automatic
13.9. Brewery Equipment Market Size (US$ Bn and Million Units), by End-user, 2017‒2031
13.9.1. Commercial
13.9.2. Industrial
13.10. Brewery Equipment Market Size (US$ Bn and Million Units), by Distribution Channel, 2017‒2031
13.10.1. Direct Sales
13.10.2. Indirect Sales
13.11. Brewery Equipment Market Size (US$ Bn and Million Units), by Country & Sub-region, 2017‒2031
13.11.1. China
13.11.2. India
13.11.3. Japan
13.11.4. Rest of Asia Pacific
13.12. Incremental Opportunity Analysis
14. Middle East & Africa Brewery Equipment Market Analysis and Forecast
14.1. Regional Snapshot
14.2. Key Trends Analysis
14.3. Macro-Economic Factors
14.4. Key Supplier Analysis
14.5. Price Trend Analysis
14.5.1. Weighted Average Selling Price (US$)
14.6. Brewery Equipment Market Size (US$ Bn and Million Units), by Product Type, 2017‒2031
14.6.1. Fermentation Unit
14.6.2. BrewHouse Unit
14.6.3. Filtration System
14.6.4. Maturation Unit
14.6.5. Others
14.7. Brewery Equipment Market Size (US$ Bn and Million Units), by Category, 2017‒2031
14.7.1. Nano/Micro Brewery
14.7.2. Macro /industrial Brewery
14.8. Brewery Equipment Market Size (US$ Bn and Million Units), by Automation, 2017‒2031
14.8.1. Manual
14.8.2. Automatic
14.8.3. Semi-Automatic
14.9. Brewery Equipment Market Size (US$ Bn and Million Units), by End-user, 2017‒2031
14.9.1. Commercial
14.9.2. Industrial
14.10. Brewery Equipment Market Size (US$ Bn and Million Units), by Distribution Channel, 2017‒2031
14.10.1. Direct Sales
14.10.2. Indirect Sales
14.11. Brewery Equipment Market Size (US$ Bn and Million Units), by Country & Sub-region, 2017‒2031
14.11.1. GCC
14.11.2. South Africa
14.11.3. Rest of Middle East & Africa
14.12. Incremental Opportunity Analysis
15. South America Brewery Equipment Market Analysis and Forecast
15.1. Regional Snapshot
15.2. Key Trends Analysis
15.3. Macro-Economic Factors
15.4. Key Supplier Analysis
15.5. Price Trend Analysis
15.5.1. Weighted Average Selling Price (US$)
15.6. Brewery Equipment Market Size (US$ Bn and Million Units), by Product Type, 2017‒2031
15.6.1. Fermentation Unit
15.6.2. BrewHouse Unit
15.6.3. Filtration System
15.6.4. Maturation Unit
15.6.5. Others
15.7. Brewery Equipment Market Size (US$ Bn and Million Units), by Category, 2017‒2031
15.7.1. Nano/Micro Brewery
15.7.2. Macro /industrial Brewery
15.8. Brewery Equipment Market Size (US$ Bn and Million Units), by Automation, 2017‒2031
15.8.1. Manual
15.8.2. Automatic
15.8.3. Semi-Automatic
15.9. Brewery Equipment Market Size (US$ Bn and Million Units), by End-user, 2017‒2031
15.9.1. Commercial
15.9.2. Industrial
15.10. Brewery Equipment Market Size (US$ Bn and Million Units), by Distribution Channel, 2017‒2031
15.10.1. Direct Sales
15.10.2. Indirect Sales
15.11. Brewery Equipment Market Size (US$ Bn and Million Units), by Country & Sub-region, 2017‒2031
15.11.1. Brazil
15.11.2. Rest of South America
15.12. Incremental Opportunity Analysis
16. Competition Landscape
16.1. Market Player – Competition Dashboard
16.2. Market Share Analysis (%), 2021
16.3. Company Profiles (Details – Company Overview, Sales Area/Geographical Presence, Financial/Revenue, Strategy & Business Overview, Sales Channel Analysis, Size Portfolio)
16.3.1. Alfa Laval
16.3.1.1. Company Overview
16.3.1.2. Sales Area/Geographical Presence
16.3.1.3. Financial/Revenue
16.3.1.4. Strategy & Business Overview
16.3.1.5. Sales Channel Analysis
16.3.1.6. Size Portfolio
16.3.2. Brewtech, Tiantai
16.3.2.1. Company Overview
16.3.2.2. Sales Area/Geographical Presence
16.3.2.3. Financial/Revenue
16.3.2.4. Strategy & Business Overview
16.3.2.5. Sales Channel Analysis
16.3.2.6. Size Portfolio
16.3.3. Criveller Group
16.3.3.1. Company Overview
16.3.3.2. Sales Area/Geographical Presence
16.3.3.3. Financial/Revenue
16.3.3.4. Strategy & Business Overview
16.3.3.5. Sales Channel Analysis
16.3.3.6. Size Portfolio
16.3.4. Della Toffola
16.3.4.1. Company Overview
16.3.4.2. Sales Area/Geographical Presence
16.3.4.3. Financial/Revenue
16.3.4.4. Strategy & Business Overview
16.3.4.5. Sales Channel Analysis
16.3.4.6. Size Portfolio
16.3.5. GEA Group
16.3.5.1. Company Overview
16.3.5.2. Sales Area/Geographical Presence
16.3.5.3. Financial/Revenue
16.3.5.4. Strategy & Business Overview
16.3.5.5. Sales Channel Analysis
16.3.5.6. Size Portfolio
16.3.6. Hypro Group
16.3.6.1. Company Overview
16.3.6.2. Sales Area/Geographical Presence
16.3.6.3. Financial/Revenue
16.3.6.4. Strategy & Business Overview
16.3.6.5. Sales Channel Analysis
16.3.6.6. Size Portfolio
16.3.7. Jinan Cassman Machinery Co., Ltd.
16.3.7.1. Company Overview
16.3.7.2. Sales Area/Geographical Presence
16.3.7.3. Financial/Revenue
16.3.7.4. Strategy & Business Overview
16.3.7.5. Sales Channel Analysis
16.3.7.6. Size Portfolio
16.3.8. Kaspar Schulz
16.3.8.1. Company Overview
16.3.8.2. Sales Area/Geographical Presence
16.3.8.3. Financial/Revenue
16.3.8.4. Strategy & Business Overview
16.3.8.5. Sales Channel Analysis
16.3.8.6. Size Portfolio
16.3.9. Meura
16.3.9.1. Company Overview
16.3.9.2. Sales Area/Geographical Presence
16.3.9.3. Financial/Revenue
16.3.9.4. Strategy & Business Overview
16.3.9.5. Sales Channel Analysis
16.3.9.6. Size Portfolio
16.3.10. Micet
16.3.10.1. Company Overview
16.3.10.2. Sales Area/Geographical Presence
16.3.10.3. Financial/Revenue
16.3.10.4. Strategy & Business Overview
16.3.10.5. Sales Channel Analysis
16.3.10.6. Size Portfolio
16.3.11. Paul Mueller
16.3.11.1. Company Overview
16.3.11.2. Sales Area/Geographical Presence
16.3.11.3. Financial/Revenue
16.3.11.4. Strategy & Business Overview
16.3.11.5. Sales Channel Analysis
16.3.11.6. Size Portfolio
17. Key Takeaway
17.1. Identification of Potential Market Spaces
17.1.1. Product Type
17.1.2. Category
17.1.3. Automation
17.1.4. End-user
17.1.5. Distribution Channel
17.1.6. Region
17.2. Understanding the Buying Process of the Customers
17.3. Preferred Sales and Marketing Strategies
List of Tables
Table 1: Global Brewery Equipment Market by Product Type, Million Units 2017‒2031
Table 2: Global Brewery Equipment Market by Product Type, US$ Bn 2017‒2031
Table 3: Global Brewery Equipment Market by Category, Million Units 2017‒2031
Table 4: Global Brewery Equipment Market by Category, US$ Bn 2017‒2031
Table 5: Global Brewery Equipment Market by Automation, Million Units 2017‒2031
Table 6: Global Brewery Equipment Market by Automation, US$ Bn 2017‒2031
Table 7: Global Brewery Equipment Market by End-user, Million Units, 2017‒2031
Table 8: Global Brewery Equipment Market by End-user, US$ Bn 2017‒2031
Table 9: Global Brewery Equipment Market by Distribution Channel, Million Units, 2017‒2031
Table 10: Global Brewery Equipment Market by Distribution Channel, US$ Bn 2017‒2031
Table 11: Global Brewery Equipment Market by Region, Million Units, 2017‒2031
Table 12: Global Brewery Equipment Market by Region, US$ Bn 2017‒2031
Table 13: North America Brewery Equipment Market by Product Type, Million Units, 2017‒2031
Table 14: North America Brewery Equipment Market by Product Type, US$ Bn 2017‒2031
Table 15: North America Brewery Equipment Market by Category, Million Units 2017‒2031
Table 16: North America Brewery Equipment Market by Category, US$ Bn 2017‒2031
Table 17: North America Brewery Equipment Market by Automation, Million Units 2017‒2031
Table 18: North America Brewery Equipment Market by Automation, US$ Bn 2017‒2031
Table 19: North America Brewery Equipment Market by End-user, Million Units, 2017‒2031
Table 20: North America Brewery Equipment Market by End-user, Million Units, 2017‒2031
Table 21: North America Brewery Equipment Market by Distribution Channel, US$ Bn 2017‒2031
Table 22: North America Brewery Equipment Market by Distribution Channel, US$ Bn 2017‒2031
Table 23: North America Brewery Equipment Market by Country & Sub-region, US$ Bn 2017‒2031
Table 24: North America Brewery Equipment Market by Country & Sub-region, US$ Bn 2017‒2031
Table 25: Europe Brewery Equipment Market by Product Type, Million Units, 2017‒2031
Table 26: Europe Brewery Equipment Market by Product Type, US$ Bn 2017‒2031
Table 27: Europe Brewery Equipment Market by Category, Million Units 2017‒2031
Table 28: Europe Brewery Equipment Market by Category, US$ Bn 2017‒2031
Table 29: Europe Brewery Equipment Market by Automation, Million Units 2017‒2031
Table 30: Europe Brewery Equipment Market by Automation, US$ Bn 2017‒2031
Table 31: Europe Brewery Equipment Market by End-user, Million Units, 2017‒2031
Table 32: Europe Brewery Equipment Market by End-user, US$ Bn 2017‒2031
Table 33: Europe Brewery Equipment Market by Distribution Channel, Million Units, 2017‒2031
Table 34: Europe Brewery Equipment Market by Distribution Channel, US$ Bn 2017‒2031
Table 35: Europe Brewery Equipment Market by Country & Sub-region, Million Units, 2017‒2031
Table 36: Europe Brewery Equipment Market by Country & Sub-region, US$ Bn 2017‒2031
Table 37: Asia-Pacific Brewery Equipment Market by Product Type, Million Units, 2017‒2031
Table 38: Asia-Pacific Brewery Equipment Market by Product Type, US$ Bn 2017‒2031
Table 39: Asia-Pacific Brewery Equipment Market by Category, Million Units 2017‒2031
Table 40: Asia-Pacific Brewery Equipment Market by Category, US$ Bn 2017‒2031
Table 41: Asia-Pacific Brewery Equipment Market by Automation, Million Units 2017‒2031
Table 42: Asia-Pacific Brewery Equipment Market by Automation, US$ Bn 2017‒2031
Table 43: Asia-Pacific Brewery Equipment Market by End-user, Million Units, 2017‒2031
Table 44: Asia-Pacific Brewery Equipment Market by End-user, US$ Bn 2017‒2031
Table 45: Asia-Pacific Brewery Equipment Market by Distribution Channel, Million Units, 2017‒2031
Table 46: Asia-Pacific Brewery Equipment Market by Distribution Channel, US$ Bn 2017‒2031
Table 47: Asia-Pacific Brewery Equipment Market by Country & Sub-region, Million Units, 2017‒2031
Table 48: Asia-Pacific Brewery Equipment Market by Country & Sub-region, US$ Bn 2017‒2031
Table 49: Middle East & Africa Brewery Equipment Market by Product Type, Million Units, 2017‒2031
Table 50: Middle East & Africa Brewery Equipment Market by Product Type, US$ Bn 2017‒2031
Table 51: Middle East & Africa Brewery Equipment Market by Category, Million Units 2017‒2031
Table 52: Middle East & Africa Brewery Equipment Market by Category, US$ Bn 2017‒2031
Table 53: Middle East & Africa Brewery Equipment Market by Automation, Million Units 2017‒2031
Table 54: Middle East & Africa Brewery Equipment Market by Automation, US$ Bn 2017‒2031
Table 55: Middle East & Africa Brewery Equipment Market by End-user, Million Units, 2017‒2031
Table 56: Middle East & Africa Brewery Equipment Market by End-user, US$ Bn 2017‒2031
Table 57: Middle East & Africa Brewery Equipment Market by Distribution Channel, Million Units, 2017‒2031
Table 58: Middle East & Africa Brewery Equipment Market by Distribution Channel, US$ Bn 2017‒2031
Table 59: Middle East & Africa Brewery Equipment Market by Country, Million Units, 2017‒2031
Table 60: Middle East & Africa Brewery Equipment Market by Country, US$ Bn 2017‒2031
Table 61: South America Brewery Equipment Market by Product Type, Million Units, 2017‒2031
Table 62: South America Brewery Equipment Market by Product Type, US$ Bn 2017‒2031
Table 63: South America Brewery Equipment Market by Category, Million Units 2017‒2031
Table 64: South America Brewery Equipment Market by Category, US$ Bn 2017‒2031
Table 65: South America Brewery Equipment Market by Automation, Million Units 2017‒2031
Table 66: South America Brewery Equipment Market by Automation, US$ Bn 2017‒2031
Table 67: South America Brewery Equipment Market by End-user, Million Units, 2017‒2031
Table 68: South America Brewery Equipment Market by End-user, US$ Bn 2017‒2031
Table 69: South America Brewery Equipment Market by Distribution Channel, Million Units, 2017‒2031
Table 70: South America Brewery Equipment Market by Distribution Channel, US$ Bn 2017‒2031
Table 71: South America Brewery Equipment Market by Country & Sub-region, Million Units, 2017‒2031
Table 72: South America Brewery Equipment Market by Country, & Sub-region US$ Bn 2017‒2031
List of Figures
Figure 1: Global Brewery Equipment Market Projections, by Product Type, Million Units 2017‒2031
Figure 2: Global Brewery Equipment Market Projections, by Product Type, US$ Bn 2017‒2031
Figure 3: Global Brewery Equipment Market, Incremental Opportunity, by Product Type, US$ Bn 2021‒2031
Figure 4: Global Brewery Equipment Market Projections, by Category, Million Units 2017‒2031
Figure 5: Global Brewery Equipment Market Projections, by Category, US$ Bn 2017‒2031
Figure 6: Global Brewery Equipment Market, Incremental Opportunity, by Category, US$ Bn 2021‒2031
Figure 7: Global Brewery Equipment Market Projections, by Automation, Million Units 2017‒2031
Figure 8: Global Brewery Equipment Market Projections, by Automation, US$ Bn 2017‒2031
Figure 9: Global Brewery Equipment Market, Incremental Opportunity, by Automation, US$ Bn 2021‒2031
Figure 10: Global Brewery Equipment Market Projections, by End-user, Million Units, 2017‒2031
Figure 11: Global Brewery Equipment Market Projections, by End-user, US$ Bn 2017‒2031
Figure 12: Global Brewery Equipment Market, Incremental Opportunity, by End-user, US$ Bn 2021‒2031
Figure 13: Global Brewery Equipment Market Projections, by Distribution Channel, Million Units, 2017‒2031
Figure 14: Global Brewery Equipment Market Projections, by Distribution Channel, US$ Bn 2017‒2031
Figure 15: Global Brewery Equipment Market, Incremental Opportunity, by Distribution Channel, US$ Bn 2021‒2031
Figure 16: Global Brewery Equipment Market Projections, by Region, Million Units, 2017‒2031
Figure 17: Global Brewery Equipment Market Projections, by Region, US$ Bn 2017‒2031
Figure 18: Global Brewery Equipment Market, Incremental Opportunity, by Region, US$ Bn 2021‒2031
Figure 19: North America Brewery Equipment Market Projections, by Product Type, Million Units, 2017‒2031
Figure 20: North America Brewery Equipment Market Projections, by Product Type, US$ Bn 2017‒2031
Figure 21: North America Brewery Equipment Market, Incremental Opportunity, by Product Type, US$ Bn 2021‒2031
Figure 22: North America Brewery Equipment Market Projections, by Category, Million Units 2017‒2031
Figure 23: North America Brewery Equipment Market Projections, by Category, US$ Bn 2017‒2031
Figure 24: North America Brewery Equipment Market, Incremental Opportunity, by Category, US$ Bn 2021‒2031
Figure 25: North America Brewery Equipment Market Projections, by Automation, Million Units 2017‒2031
Figure 26: North America Brewery Equipment Market Projections, by Automation, US$ Bn 2017‒2031
Figure 27: North America Brewery Equipment Market, Incremental Opportunity, by Automation, US$ Bn 2021‒2031
Figure 28: North America Brewery Equipment Market Projections, by End-user, Million Units, 2017‒2031
Figure 29: North America Brewery Equipment Market Projections, by End-user, US$ Bn 2017‒2031
Figure 30: North America Brewery Equipment Market, Incremental Opportunity, by End-user, US$ Bn 2021‒2031
Figure 31: North America Brewery Equipment Market Projections, by Distribution Channel, Million Units, 2017‒2031
Figure 32: North America Brewery Equipment Market Projections, by Distribution Channel, US$ Bn 2017‒2031
Figure 33: North America Brewery Equipment Market, Incremental Opportunity, by Distribution Channel, US$ Bn 2021‒2031
Figure 34: North America Brewery Equipment Market Projections, by Country, Million Units, 2017‒2031
Figure 35: North America Brewery Equipment Market Projections, by Country, US$ Bn 2017‒2031
Figure 36: North America Brewery Equipment Market, Incremental Opportunity, by Country, US$ Bn 2021‒2031
Figure 37: Europe Brewery Equipment Market Projections, by Product Type, Million Units, 2017‒2031
Figure 38: Europe Brewery Equipment Market Projections, by Product Type, US$ Bn 2017‒2031
Figure 39: Europe Brewery Equipment Market, Incremental Opportunity, by Product Type, US$ Bn 2021‒2031
Figure 40: Europe Brewery Equipment Market Projections, by Category, Million Units 2017‒2031
Figure 41: Europe Brewery Equipment Market Projections, by Category, US$ Bn 2017‒2031
Figure 42: Europe Brewery Equipment Market, Incremental Opportunity, by Category, US$ Bn 2021‒2031
Figure 43: Europe Brewery Equipment Market Projections, by Automation, Million Units 2017‒2031
Figure 44: Europe Brewery Equipment Market Projections, by Automation, US$ Bn 2017‒2031
Figure 45: Europe Brewery Equipment Market, Incremental Opportunity, by Automation, US$ Bn 2021‒2031
Figure 46: Europe Brewery Equipment Market Projections, by End-user, Million Units, 2017‒2031
Figure 47: Europe Brewery Equipment Market Projections, by End-user, US$ Bn 2017‒2031
Figure 48: Europe Brewery Equipment Market, Incremental Opportunity, by End-user, US$ Bn 2021‒2031
Figure 49: Europe Brewery Equipment Market Projections, by Distribution Channel, Million Units, 2017‒2031
Figure 50: Europe Brewery Equipment Market Projections, by Distribution Channel, US$ Bn 2017‒2031
Figure 51: Europe Brewery Equipment Market, Incremental Opportunity, by Distribution Channel, US$ Bn 2021‒2031
Figure 52: Europe Brewery Equipment Market Projections, by Country & Sub-region, Million Units, 2017‒2031
Figure 53: Europe Brewery Equipment Market Projections, by Country & Sub-region, US$ Bn 2017‒2031
Figure 54: Europe Brewery Equipment Market, Incremental Opportunity, by Country & Sub-region, US$ Bn 2021‒2031
Figure 55: Asia-Pacific Brewery Equipment Market Projections, by Product Type, Million Units, 2017‒2031
Figure 56: Asia-Pacific Brewery Equipment Market Projections, by Product Type, US$ Bn 2017‒2031
Figure 57: Asia-Pacific Brewery Equipment Market, Incremental Opportunity, by Product Type, US$ Bn 2021‒2031
Figure 58: Asia-Pacific Brewery Equipment Market Projections, by Category, Million Units 2017‒2031
Figure 59: Asia-Pacific Brewery Equipment Market Projections, by Category, US$ Bn 2017‒2031
Figure 60: Asia-Pacific Brewery Equipment Market, Incremental Opportunity, by Category, US$ Bn 2021‒2031
Figure 61: Asia-Pacific Brewery Equipment Market Projections, by Automation, Million Units 2017‒2031
Figure 62: Asia-Pacific Brewery Equipment Market Projections, by Automation, US$ Bn 2017‒2031
Figure 63: Asia-Pacific Brewery Equipment Market, Incremental Opportunity, by Automation, US$ Bn 2021‒2031
Figure 64: Asia-Pacific Brewery Equipment Market Projections, by End-user, Million Units, 2017‒2031
Figure 65: Asia-Pacific Brewery Equipment Market Projections, by End-user, US$ Bn 2017‒2031
Figure 66: Asia-Pacific Brewery Equipment Market, Incremental Opportunity, by End-user, US$ Bn 2021‒2031
Figure 67: Asia-Pacific Brewery Equipment Market Projections, by Distribution Channel, Million Units, 2017‒2031
Figure 68: Asia-Pacific Brewery Equipment Market Projections, by Distribution Channel, US$ Bn 2017‒2031
Figure 69: Asia-Pacific Brewery Equipment Market, Incremental Opportunity, by Distribution Channel, US$ Bn 2021‒2031
Figure 70: Asia-Pacific Brewery Equipment Market Projections, by Country & Sub-region, Million Units, 2017‒2031
Figure 71: Asia-Pacific Brewery Equipment Market Projections, by Country & Sub-region, US$ Bn 2017‒2031
Figure 72: Asia-Pacific Brewery Equipment Market, Incremental Opportunity, by Country & Sub-region, US$ Bn 2021‒2031
Figure 73: Middle East & Africa Brewery Equipment Market Projections, by Product Type, Million Units, 2017‒2031
Figure 74: Middle East & Africa Brewery Equipment Market Projections, by Product Type, US$ Bn 2017‒2031
Figure 75: Middle East & Africa Brewery Equipment Market, Incremental Opportunity, by Product Type, US$ Bn 2021‒2031
Figure 76: Middle East & Africa Brewery Equipment Market Projections, by Category, Million Units 2017‒2031
Figure 77: Middle East & Africa Brewery Equipment Market Projections, by Category, US$ Bn 2017‒2031
Figure 78: Middle East & Africa Brewery Equipment Market, Incremental Opportunity, by Category, US$ Bn 2021‒2031
Figure 79: Middle East & Africa Brewery Equipment Market Projections, by Automation, Million Units 2017‒2031
Figure 80: Middle East & Africa Brewery Equipment Market Projections, by Automation, US$ Bn 2017‒2031
Figure 81: Middle East & Africa Brewery Equipment Market, Incremental Opportunity, by Automation, US$ Bn 2021‒2031
Figure 82: Middle East & Africa Brewery Equipment Market Projections, by End-user, Million Units, 2017‒2031
Figure 83: Middle East & Africa Brewery Equipment Market Projections, by End-user, US$ Bn 2017‒2031
Figure 84: Middle East & Africa Brewery Equipment Market, Incremental Opportunity, by End-user, US$ Bn 2021‒2031
Figure 85: Middle East & Africa Brewery Equipment Market Projections, by Distribution Channel, Million Units, 2017‒2031
Figure 86: Middle East & Africa Brewery Equipment Market Projections, by Distribution Channel, US$ Bn 2017‒2031
Figure 87: Middle East & Africa Brewery Equipment Market, Incremental Opportunity, by Distribution Channel, US$ Bn 2021‒2031
Figure 88: Middle East & Africa Brewery Equipment Market Projections, by Country & Sub-region, Million Units, 2017‒2031
Figure 89: Middle East & Africa Brewery Equipment Market Projections, by Country & Sub-region, US$ Bn 2017‒2031
Figure 90: Middle East & Africa Brewery Equipment Market, Incremental Opportunity, by Country & Sub-region, US$ Bn 2021‒2031
Figure 91: South America Brewery Equipment Market Projections, by Product Type, Million Units, 2017‒2031
Figure 92: South America Brewery Equipment Market Projections, by Product Type, US$ Bn 2017‒2031
Figure 93: South America Brewery Equipment Market, Incremental Opportunity, by Product Type, US$ Bn 2021‒2031
Figure 94: South America Brewery Equipment Market Projections, by Category, Million Units 2017‒2031
Figure 95: South America Brewery Equipment Market Projections, by Category, US$ Bn 2017‒2031
Figure 96: South America Brewery Equipment Market, Incremental Opportunity, by Category, US$ Bn 2021‒2031
Figure 97: South America Brewery Equipment Market Projections, by Automation, Million Units 2017‒2031
Figure 98: South America Brewery Equipment Market Projections, by Automation, US$ Bn 2017‒2031
Figure 99: South America Brewery Equipment Market, Incremental Opportunity, by Automation, US$ Bn 2021‒2031
Figure 100: South America Brewery Equipment Market Projections, by End-user, Million Units, 2017‒2031
Figure 101: South America Brewery Equipment Market Projections, by End-user, US$ Bn 2017‒2031
Figure 102: South America Brewery Equipment Market, Incremental Opportunity, by End-user, US$ Bn 2021‒2031
Figure 103: South America Brewery Equipment Market Projections, by Distribution Channel, Million Units, 2017‒2031
Figure 104: South America Brewery Equipment Market Projections, by Distribution Channel, US$ Bn 2017‒2031
Figure 105: South America Brewery Equipment Market, Incremental Opportunity, by Distribution Channel, US$ Bn 2021‒2031
Figure 106: South America Brewery Equipment Market Projections, by Country & Sub-region, Million Units, 2017‒2031
Figure 107: South America Brewery Equipment Market Projections, by Country & Sub-region, US$ Bn 2017‒2031
Figure 108: South America Brewery Equipment Market, Incremental Opportunity, by Country & Sub-region, US$ Bn 2021‒2031
Copyright © Transparency Market Research, Inc. All Rights reserved
Trust Online

Brewery Equipment Market
