AI (Artificial Intelligence) and ML (Machine Learning) are virtually penetrating almost all industries, including healthcare. These technologies are generating incremental opportunities for companies in the breast imaging market. The alarming rate of women in the U.S. that may be susceptible to breast cancer during their lifetime has led to the adoption of AI and ML to improve patient quality of life. The market in the U.S., one of the major economies of North America, is anticipated to generate the highest revenue and is predicted for exponential growth. There is a growing need for early detection and increased awareness among patients in the market for breast imaging.
Early detection of lesions with the help of AI and ML has helped to improve clinical numbers. This phenomena is being further leveraged with advanced screening mammography, whereas this technique is gaining global recognition as one of the most effective methods for detecting early breast cancer. This explains why ionizing breast imaging dictates the highest revenue among all technologies in the breast imaging market.
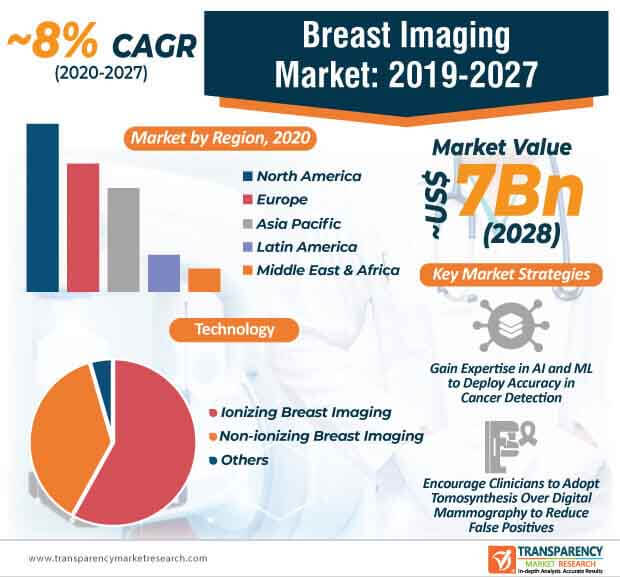
Early cancer detection has become one of the important prerequisites for most women worldwide. Hence, healthcare companies are gaining expertise in digital breast imaging to improve cancer diagnosis. Such advancements are boosting the revenue of breast imaging market, which is estimated to be valued at ~US$ 7 Bn by the end of 2028. On the other hand, clinicians are building their credibility by gaining efficacy in FDA-approved technologies for breast imaging. Such technologies are supporting a wide range of clinical research studies and the development of innovative products related to breast cancer.
Apart from innovations in the breast imaging market, clinicians are creating an awareness about radiologist-patient communication as the key to offer a more patient-centric atmosphere in hospitals and clinics. Thus, along with innovations in breast imaging, healthcare providers need to understand that patients are more willing to interact with their radiologist, while being educated about their individual circumstances.
Advantages offered by tomosynthesis are anticipated to outperform the offerings of digital mammography. However, in the current scenario, the rapidly evolving COVID-19 (Coronavirus) has forced stakeholders to cancel and reschedule important conferences associated with breast imaging. For instance, the 2020 Society of Breast Imaging/American College of Radiology (SBI/ACR) annual symposium has been cancelled and rescheduled for April 8 - April 11, 2021, in Savannah, Georgia, U.S. Such unwelcome pandemics are slowing down the pace of innovations in the breast imaging market. Hence, healthcare companies are taking cues from previous and ongoing research materials available at their disposal.
Newly published studies are offering important insights to technology companies that are shifting their focus to digital breast tomosynthesis (DBT) from digital mammography (DM). Thus, the breast imaging market is continuously growing due to largely consolidated players dominating ~45%-50% of the market share in 2018. The DBT is being highly publicized for effective breast imaging in order to reduce the incidences of false positives.
Analysts’ Viewpoint
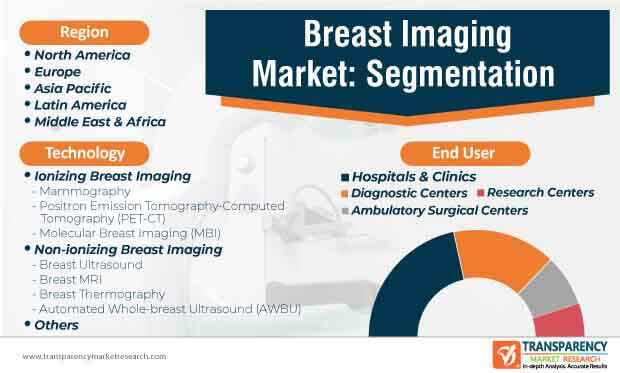
The analysts of Transparency Market Research (TMR) anticipate that improved radiologist-patient communication is building the credibility of hospitals and clinics, thus making breast imaging widely accepted in developing economies of Asia Pacific. The breast imaging market is undergoing transformation with the introduction of AI and ML in early detection of lesions.
Moreover, DBT is gaining popularity over DM as a powerful tool for breast cancer screening. However, the volume of published data on DBT is limited to only first round of screening, thus creating ambiguity about the performance of the DBT over prolonged periods of time. Hence, companies should increase their efficacy in five-year research studies and more to create the availability of enough clinical data about DBT in order to establish its widespread application.
Breast imaging market is estimated to be valued at US$ 7 Bn by the end of 2028
Breast imaging market is projected to expand at a CAGR of 8% from 2020 to 2028
Breast imaging market is driven by growing preference for mammography screening
North America accounted for a major share of the global breast imaging market and the trend is anticipated to continue during the forecast period
Key players in the global breast imaging market include GE Healthcare, Koninklijke Philips N.V., Hologic, Inc., Siemens Healthineers, Fujifilm Holding Corporation
1. Preface
1.1. Report Scope and Market Segmentation
1.2. Research Highlights
2. Assumptions and Research Methodology
2.1. Assumptions
2.2. Research Methodology
3. Executive Summary
3.1. Global Breast Imaging Market Snapshot
4. Market Overview
4.1. Product Overview
4.2. Key Industry Events
4.3. Market Dynamics
4.4. Drivers and Restraints Snapshot Analysis
4.4.1. Drivers
4.4.2. Restraints
4.4.3. Opportunities
4.5. Global Breast Imaging Market Revenue Projection
4.6. Global Breast Imaging Market Outlook
5. Market Outlook
5.1. Breast Cancer Incidence and Mortality Rate, by Region in 2018
5.2. Global Risk of Breast Cancer
5.3. Top Three Players Operating in the Market Space
6. Global Breast Imaging Market Analysis, by Technology
6.1. Introduction
6.2. Global Breast Imaging Market Value Share and Attractiveness Analysis, by Technology
6.3. Global Breast Imaging Market Forecast, by Technology
6.3.1. Ionizing Breast Imaging
6.3.1.1. Mammography
6.3.1.1.1. Analog Mammography
6.3.1.1.2. Digital Mammography
6.3.1.2. Positron Emission Tomography-Computed Tomography (PET-CT)
6.3.1.3. Molecular Breast Imaging (MBI)
6.3.2. Non-ionizing Breast Imaging
6.3.2.1. Breast Ultrasound
6.3.2.2. Breast MRI
6.3.2.3. Breast Thermography
6.3.2.4. Automated Whole-breast Ultrasound (AWBU)
6.3.3. Others
6.4. Global Breast Imaging Market Analysis, by Technology
7. Global Breast Imaging Market Analysis, by End-user
7.1. Introduction
7.2. Global Breast Imaging Market Value Share and Attractiveness Analysis, by End-user
7.3. Global Breast Imaging Market Forecast, by End-user
7.3.1. Hospitals & Clinics
7.3.2. Diagnostic Centers
7.3.3. Ambulatory Surgical Centers
7.3.4. Research Centers
7.4. Global Breast Imaging Market Analysis, by End-user
8. Global Breast Imaging Market Analysis, by Region
8.1. Global Breast Imaging Market Scenario, by Country
8.2. Global Breast Imaging Market Value Share and Attractiveness Analysis, by Region
8.3. Global Breast Imaging Market Forecast, by Region
8.3.1. North America
8.3.2. Europe
8.3.3. Asia Pacific
8.3.4. Latin America
8.3.5. Middle East & Africa
9. North America Breast Imaging Market Analysis
9.1. Key Findings
9.2. North America Breast Imaging Market Overview
9.3. North America Breast Imaging Market Value Share and Attractiveness Analysis, by Country
9.4. North America Breast Imaging Market Forecast, by Country
9.4.1. U.S.
9.4.2. Canada
9.5. North America Breast Imaging Market Value Share and Attractiveness Analysis, by Technology
9.6. North America Breast Imaging Market Forecast, by Technology
9.6.1. Ionizing Breast Imaging
9.6.1.1. Mammography
9.6.1.1.1. Analog Mammography
9.6.1.1.2. Digital Mammography
9.6.1.2. Positron Emission Tomography-Computed Tomography (PET-CT)
9.6.1.3. Molecular Breast Imaging (MBI)
9.6.2. Non-ionizing Breast Imaging
9.6.2.1. Breast Ultrasound
9.6.2.2. Breast MRI
9.6.2.3. Breast Thermography
9.6.2.4. Automated Whole-breast Ultrasound (AWBU)
9.6.3. Others
9.7. North America Breast Imaging Market Value Share and Attractiveness Analysis, by End-user
9.8. North America Breast Imaging Market Forecast, by End-user
9.8.1. Hospitals & Clinics
9.8.2. Diagnostic Centers
9.8.3. Ambulatory Surgical Centers
9.8.4. Research Centers
10. Europe Breast Imaging Market Analysis
10.1. Key Findings
10.2. Europe Breast Imaging Market Overview
10.3. Europe Breast Imaging Market Value Share and Attractiveness Analysis, by Country/Sub-region
10.4. Europe Breast Imaging Market Forecast, by Country/Sub-region
10.4.1. Germany
10.4.2. France
10.4.3. Italy
10.4.4. Spain
10.4.5. U.K.
10.4.6. Rest of Europe
10.5. Europe Breast Imaging Market Value Share and Attractiveness Analysis, by Technology
10.6. Europe Breast Imaging Market Forecast, by Technology
10.6.1. Ionizing Breast Imaging
10.6.1.1. Mammography
10.6.1.1.1. Analog Mammography
10.6.1.1.2. Digital Mammography
10.6.1.2. Positron Emission Tomography-Computed Tomography (PET-CT)
10.6.1.3. Molecular Breast Imaging (MBI)
10.6.2. Non-ionizing Breast Imaging
10.6.2.1. Breast Ultrasound
10.6.2.2. Breast MRI
10.6.2.3. Breast Thermography
10.6.2.4. Automated Whole-breast Ultrasound (AWBU)
10.6.3. Others
10.7. Europe Breast Imaging Market Value Share and Attractiveness Analysis, by End-user
10.8. Europe Breast Imaging Market Forecast, by End-user
10.8.1. Hospitals & Clinics
10.8.2. Diagnostic Centers
10.8.3. Ambulatory Surgical Centers
10.8.4. Research Centers
11. Asia Pacific Breast Imaging Market Analysis
11.1. Key Findings
11.2. Asia Pacific Breast Imaging Market Overview
11.3. Asia Pacific Breast Imaging Market Value Share and Attractiveness Analysis, by Country/Sub-region
11.4. Asia Pacific Breast Imaging Market Forecast, by Country/Sub-region
11.4.1. China
11.4.2. Japan
11.4.3. India
11.4.4. Australia & New Zealand
11.4.5. Rest of Asia Pacific
11.5. Asia Pacific Breast Imaging Market Value Share and Attractiveness Analysis, by Technology
11.6. Asia Pacific Breast Imaging Market Forecast, by Technology
11.6.1. Ionizing Breast Imaging
11.6.1.1. Mammography
11.6.1.1.1. Analog Mammography
11.6.1.1.2. Digital Mammography
11.6.1.2. Positron Emission Tomography-Computed Tomography (PET-CT)
11.6.1.3. Molecular Breast Imaging (MBI)
11.6.2. Non-ionizing Breast Imaging
11.6.2.1. Breast Ultrasound
11.6.2.2. Breast MRI
11.6.2.3. Breast Thermography
11.6.2.4. Automated Whole-breast Ultrasound (AWBU)
11.6.3. Others
11.7. Asia Pacific Breast Imaging Market Value Share and Attractiveness Analysis, by End-user
11.8. Asia Pacific Breast Imaging Market Forecast, by End-user
11.8.1. Hospitals & Clinics
11.8.2. Diagnostic Centers
11.8.3. Ambulatory Surgical Centers
11.8.4. Research Centers
12. Latin America Breast Imaging Market Analysis
12.1. Key Findings
12.2. Latin America Breast Imaging Market Overview
12.3. Latin America Breast Imaging Market Value Share and Attractiveness Analysis, by Country/Sub-region
12.4. Latin America Breast Imaging Market Forecast, by Country/Sub-region
12.4.1. Brazil
12.4.2. Mexico
12.4.3. Rest of Latin America
12.5. Latin America Breast Imaging Market Value Share and Attractiveness Analysis, by Technology
12.6. Latin America Breast Imaging Market Forecast, by Technology
12.6.1. Ionizing Breast Imaging
12.6.1.1. Mammography
12.6.1.1.1. Analog Mammography
12.6.1.1.2. Digital Mammography
12.6.1.2. Positron Emission Tomography-Computed Tomography (PET-CT)
12.6.1.3. Molecular Breast Imaging (MBI)
12.6.2. Non-ionizing Breast Imaging
12.6.2.1. Breast Ultrasound
12.6.2.2. Breast MRI
12.6.2.3. Breast Thermography
12.6.2.4. Automated Whole-breast Ultrasound (AWBU)
12.6.3. Others
12.7. Latin America Breast Imaging Market Value Share and Attractiveness Analysis, by End-user
12.8. Latin America Breast Imaging Market Forecast, by End-user
12.8.1. Hospitals & Clinics
12.8.2. Diagnostic Centers
12.8.3. Ambulatory Surgical Centers
12.8.4. Research Centers
13. Middle East & Africa Breast Imaging Market Analysis
13.1. Key Findings
13.2. Middle East & Africa Breast Imaging Market Overview
13.3. Middle East & Africa Breast Imaging Market Value Share and Attractiveness Analysis, by Country/Sub-region
13.4. Middle East & Africa Breast Imaging Market Forecast, by Country/Sub-region
13.4.1. GCC Countries
13.4.2. South Africa
13.4.3. Rest of Middle East & Africa
13.5. Middle East & Africa Breast Imaging Market Value Share and Attractiveness Analysis, by Technology
13.6. Middle East & Africa Breast Imaging Market Forecast, by Technology
13.6.1. Ionizing Breast Imaging
13.6.1.1. Mammography
13.6.1.1.1. Analog Mammography
13.6.1.1.2. Digital Mammography
13.6.1.2. Positron Emission Tomography-Computed Tomography (PET-CT)
13.6.1.3. Molecular Breast Imaging (MBI)
13.6.2. Non-ionizing Breast Imaging
13.6.2.1. Breast Ultrasound
13.6.2.2. Breast MRI
13.6.2.3. Breast Thermography
13.6.2.4. Automated Whole-breast Ultrasound (AWBU)
13.6.3. Others
13.7. Middle East & Africa Breast Imaging Market Value Share and Attractiveness Analysis, by End-user
13.8. Middle East & Africa Breast Imaging Market Forecast, by End-user
13.8.1. Hospitals & Clinics
13.8.2. Diagnostic Centers
13.8.3. Ambulatory Surgical Centers
13.8.4. Research Centers
14. Competition Analysis
14.1. Global Breast Imaging Market Share Analysis, by Company (2018)
14.2. Competition Matrix
14.3. Company Profile
14.3.1. GE Healthcare (General Electric Company)
14.3.1.1. Company Overview (HQ, Business Segments, Employee Strength)
14.3.1.2. Financial Overview
14.3.1.3. Product Portfolio
14.3.1.4. SWOT Analysis
14.3.1.5. Strategic Overview
14.3.2. Koninklijke Philips N.V.
14.3.2.1. Company Overview (HQ, Business Segments, Employee Strength)
14.3.2.2. Financial Overview
14.3.2.3. Product Portfolio
14.3.2.4. SWOT Analysis
14.3.2.5. Strategic Overview
14.3.3. Hologic, Inc.
14.3.3.1. Company Overview (HQ, Business Segments, Employee Strength)
14.3.3.2. Financial Overview
14.3.3.3. Product Portfolio
14.3.3.4. SWOT Analysis
14.3.3.5. Strategic Overview
14.3.4. Siemens Healthineers (Siemens AG)
14.3.4.1. Company Overview (HQ, Business Segments, Employee Strength)
14.3.4.2. Financial Overview
14.3.4.3. Product Portfolio
14.3.4.4. SWOT Analysis
14.3.4.5. Strategic Overview
14.3.5. Fujifilm Holding Corporation
14.3.5.1. Company Overview (HQ, Business Segments, Employee Strength)
14.3.5.2. Financial Overview
14.3.5.3. Product Portfolio
14.3.5.4. SWOT Analysis
14.3.5.5. Strategic Overview
14.3.6. Canon Medical Systems Corporation (Canon Inc.)
14.3.6.1. Company Overview (HQ, Business Segments, Employee Strength)
14.3.6.2. Financial Overview
14.3.6.3. Product Portfolio
14.3.6.4. SWOT Analysis
14.3.6.5. Strategic Overview
14.3.7. Aurora Imaging Technologies, Inc.
14.3.7.1. Company Overview (HQ, Business Segments, Employee Strength)
14.3.7.2. Financial Overview
14.3.7.3. Product Portfolio
14.3.7.4. SWOT Analysis
14.3.7.5. Strategic Overview
14.3.8. Dilon Technologies, Inc.
14.3.8.1. Company Overview (HQ, Business Segments, Employee Strength)
14.3.8.2. Financial Overview
14.3.8.3. Product Portfolio
14.3.8.4. SWOT Analysis
14.3.8.5. Strategic Overview
14.3.9. Leica Biosystems Nussloch GmbH (Danaher)
14.3.9.1. Company Overview (HQ, Business Segments, Employee Strength)
14.3.9.2. Financial Overview
14.3.9.3. Product Portfolio
14.3.9.4. SWOT Analysis
14.3.9.5. Strategic Overview
List of Tables
Table 01: Global Risk of Breast Cancer
Table 02: Global Breast Imaging Market Value (US$ Mn) Forecast, by Technology, 2018-2028
Table 03: Global Breast Imaging Market Value (US$ Mn) Forecast, by Ionizing Breast Imaging, 2018-2028
Table 04: Global Breast Imaging Market Value (US$ Mn) Forecast, by Mammography, 2018-2028
Table 05: Global Breast Imaging Market Value (US$ Mn) Forecast, by Non-ionizing Breast Imaging, 2018-2028
Table 06: Global Breast Imaging Market Value (US$ Mn) Forecast, by End-user, 2018-2028
Table 07: Global Breast Imaging Market Value (US$ Mn) Forecast, by Region, 2018-2028
Table 08: North America Breast Imaging Market Value (US$ Mn) Forecast, by Country, 2018-2028
Table 09: North America Breast Imaging Market Value (US$ Mn) Forecast, by Technology, 2018-2028
Table 10: North America Breast Imaging Market Value (US$ Mn) Forecast, by Ionizing Breast Imaging, 2018-2028
Table 11: North America Breast Imaging Market Value (US$ Mn) Forecast, by Mammography, 2018-2028
Table 12: North America Breast Imaging Market Value (US$ Mn) Forecast, by Non-ionizing Breast Imaging, 2018-2028
Table 13: North America Breast Imaging Market Value (US$ Mn) Forecast, by End-user, 2018-2028
Table 14: Europe Breast Imaging Market Value (US$ Mn) Forecast, by Country/Sub-region, 2018-2028
Table 15: Europe Breast Imaging Market Value (US$ Mn) Forecast, by Technology, 2018-2028
Table 16: Europe Breast Imaging Market Value (US$ Mn) Forecast, by Ionizing Breast Imaging, 2018-2028
Table 17: Europe Breast Imaging Market Value (US$ Mn) Forecast, by Mammography, 2018-2028
Table 18: Europe Breast Imaging Market Value (US$ Mn) Forecast, by Non-ionizing Breast Imaging, 2018-2028
Table 19: Europe Breast Imaging Market Value (US$ Mn) Forecast, by End-user, 2018-2028
Table 20: Asia Pacific Breast Imaging Market Value (US$ Mn) Forecast, by Country/Sub-region, 2018-2028
Table 21: Asia Pacific Breast Imaging Market Value (US$ Mn) Forecast, by Technology, 2018-2028
Table 22: Asia Pacific Breast Imaging Market Value (US$ Mn) Forecast, by Ionizing Breast Imaging, 2018-2028
Table 23: Asia Pacific Breast Imaging Market Value (US$ Mn) Forecast, by Mammography, 2018-2028
Table 24: Asia Pacific Breast Imaging Market Value (US$ Mn) Forecast, by Non-ionizing Breast Imaging, 2018-2028
Table 25: Asia Pacific Breast Imaging Market Value (US$ Mn) Forecast, by End-user, 2018-2028
Table 26: Latin America Breast Imaging Market Value (US$ Mn) Forecast, by Country/Sub-region, 2018-2028
Table 27: Latin America Breast Imaging Market Value (US$ Mn) Forecast, by Technology, 2018-2028
Table 28: Latin America Breast Imaging Market Value (US$ Mn) Forecast, by Ionizing Breast Imaging, 2018-2028
Table 29: Latin America Breast Imaging Market Value (US$ Mn) Forecast, by Mammography, 2018-2028
Table 30: Latin America Breast Imaging Market Value (US$ Mn) Forecast, by Non-ionizing Breast Imaging, 2018-2028
Table 31: Latin America Breast Imaging Market Value (US$ Mn) Forecast, by End-user, 2018-2028
Table 32: Middle East & Africa Breast Imaging Market Value (US$ Mn) Forecast, by Country/Sub-region, 2018-2028
Table 33: Middle East & Africa Breast Imaging Market Value (US$ Mn) Forecast, by Technology, 2018-2028
Table 34: Middle East & Africa Breast Imaging Market Value (US$ Mn) Forecast, by Ionizing Breast Imaging, 2018-2028
Table 35: Middle East & Africa Breast Imaging Market Value (US$ Mn) Forecast, by Mammography, 2018-2028
Table 36: Middle East & Africa Breast Imaging Market Value (US$ Mn) Forecast, by Non-ionizing Breast Imaging, 2018-2028
Table 37: Middle East & Africa Breast Imaging Market Value (US$ Mn) Forecast, by End-user, 2018-2028
List of Figures
Figure 01: Global Breast Imaging Market Value (US$ Mn) and Distribution (%), by Region, 2019 and 2028
Figure 02: Global Breast Imaging Market Size (US$ Mn) and Forecast, 2020-2028
Figure 03: Global Breast Imaging Market Value Share (%), by Technology, 2019
Figure 04: Global Breast Imaging Market Value Share (%), by Region, 2019
Figure 05: Global Breast Imaging Market Value Share (%), by End-user, 2019
Figure 06: Global Breast Imaging Market Value Share Analysis, by Technology, 2019 and 2028
Figure 07: Global Breast Imaging Market Attractiveness, by Technology, 2020-2028
Figure 08: Global Breast Imaging Market Revenue (US$ Mn) and Y-o-Y Growth (%), by Ionizing Breast Imaging, 2018-2028
Figure 09: Global Breast Imaging Market Revenue (US$ Mn) and Y-o-Y Growth (%), by Non-ionizing Breast Imaging, 2018-2028
Figure 10: Global Breast Imaging Market Revenue (US$ Mn) and Y-o-Y Growth (%), by Others, 2018-2028
Figure 11: Global Breast Imaging Market Value Share, by End-user, 2019 and 2028
Figure 12: Global Breast Imaging Market Attractiveness, by End-user, 2020-2028
Figure 13: Global Breast Imaging Market Revenue (US$ Mn) and Y-o-Y Growth (%), by Hospitals & Clinics, 2018-2028
Figure 14: Global Breast Imaging Market Revenue (US$ Mn) and Y-o-Y Growth (%), by Diagnostic Centers, 2018-2028
Figure 15: Global Breast Imaging Market Revenue (US$ Mn) and Y-o-Y Growth (%), by Ambulatory Surgical Centers, 2018-2028
Figure 16: Global Breast Imaging Market Revenue (US$ Mn) and Y-o-Y Growth (%), by Research Centers, 2018-2028
Figure 17: Global Breast Imaging Market Value Share, by Region, 2019 and 2028
Figure 18: Global Breast Imaging Market Attractiveness, by Region, 2020-2028
Figure 19: North America Breast Imaging Market Value (US$ Mn) Forecast and Y-o-Y Growth (%) Projection, 2018-2028
Figure 20: North America Breast Imaging Market Value Share Analysis, by Country, 2019 and 2028
Figure 21: North America Breast Imaging Market Attractiveness, by Country, 2020-2028
Figure 22: North America Breast Imaging Market Value Share Analysis, by Technology, 2019 and 2028
Figure 23: North America Breast Imaging Market Attractiveness, by Technology, 2020-2028
Figure 24: North America Breast Imaging Market Value Share, by End-user, 2019 and 2028
Figure 25: North America Breast Imaging Market Attractiveness, by End-user, 2020-2028
Figure 26: Europe Breast Imaging Market Value (US$ Mn) Forecast and Y-o-Y Growth (%) Projection, 2018-2028
Figure 27: Europe Breast Imaging Market Value Share Analysis, by Countries/Sub-region, 2019 and 2028
Figure 28: Europe Breast Imaging Market Attractiveness, by Countries/Sub-region, 2020-2028
Figure 29: Europe Breast Imaging Market Value Share Analysis, by Technology, 2019 and 2028
Figure 30: Europe Breast Imaging Market Attractiveness, by Technology, 2020-2028
Figure 31: Europe Breast Imaging Market Value Share, by End-user, 2019 and 2028
Figure 32: Europe Breast Imaging Market Attractiveness, by End-user, 2020-2028
Figure 33: Asia Pacific Breast Imaging Market Value (US$ Mn) Forecast and Y-o-Y Growth (%) Projection, 2018-2028
Figure 34: Asia Pacific Breast Imaging Market Value Share Analysis, by Countries/Sub-region, 2019 and 2028
Figure 35: Asia Pacific Breast Imaging Market Attractiveness, by Countries/Sub-region, 2020-2028
Figure 36: Asia Pacific Breast Imaging Market Value Share Analysis, by Technology, 2019 and 2028
Figure 37: Asia Pacific Breast Imaging Market Attractiveness, by Technology, 2020-2028
Figure 38: Asia Pacific Breast Imaging Market Value Share, by End-user, 2019 and 2028
Figure 39: Asia Pacific Breast Imaging Market Attractiveness, by End-user, 2020-2028
Figure 40: Latin America Breast Imaging Market Value (US$ Mn) Forecast and Y-o-Y Growth (%) Projection, 2018-2028
Figure 41: Latin America Breast Imaging Market Value Share Analysis, by Countries/Sub-region, 2019 and 2028
Figure 42: Latin America Breast Imaging Market Attractiveness, by Countries/Sub-region, 2020-2028
Figure 43: Latin America Breast Imaging Market Value Share Analysis, by Technology, 2019 and 2028
Figure 44: Latin America Breast Imaging Market Attractiveness, by Technology, 2020-2028
Figure 45: Latin America Breast Imaging Market Value Share, by End-user, 2019 and 2028
Figure 46: Latin America Breast Imaging Market Attractiveness, by End-user, 2020-2028
Figure 47: Middle East & Africa Breast Imaging Market Value (US$ Mn) Forecast and Y-o-Y Growth (%) Projection, 2018-2028
Figure 48: Middle East & Africa Breast Imaging Market Value Share Analysis, by Countries/Sub-region, 2019 and 2028
Figure 49: Middle East & Africa Breast Imaging Market Attractiveness, by Countries/Sub-region, 2020-2028
Figure 50: Middle East & Africa Breast Imaging Market Value Share Analysis, by Technology, 2019 and 2028
Figure 51: Middle East & Africa Breast Imaging Market Attractiveness, by Technology, 2020-2028
Figure 52: Middle East & Africa Breast Imaging Market Value Share, by End-user, 2019 and 2028
Figure 53: Middle East & Africa Breast Imaging Market Attractiveness, by End-user, 2020-2028
Figure 54: Global Breast Imaging Market Share, by Company, 2018
Figure 55: GE Healthcare Revenue (US$ Mn) and Y-o-Y Growth (%), 2015–2018
Figure 56: GE Healthcare Breakdown of Net Sales (%), by Region, 2018
Figure 57: GE Healthcare Breakdown of Net Sales (%), by Business Segment, 2018
Figure 58: Koninklijke Philips N.V. Revenue (US$ Mn) and Y-o-Y Growth (%),
Figure 59: Koninklijke Philips N.V., Breakdown of Net Sales (%), by Region, 2018
Figure 60: Koninklijke Philips N.V., Breakdown of Net Sales (%), by Business Segment, 2018
Figure 61: Hologic, Inc., Revenue (US$ Mn) and Y-o-Y Growth (%), 2015-2019
Figure 62: Hologic Inc., Breakdown of Net Sales (%), by Region, 2019
Figure 63: Hologic, Inc., Breakdown of Net Sales (%), by Business Segment, 2019
Figure 64: Siemens Healthineers Revenue (US$ Bn) and Y-o-Y Growth (%), 2014-2018
Figure 65: Siemens Healthineers Diagnostics Business Segment, Breakdown of Net Sales (%), by Region, 2018
Figure 66: Siemens Healthineers Diagnostics Business Segment, Breakdown of Net Sales (%), by Business Segment, 2018
Figure 67: Fujifilm Holding Corporation Revenue (US$ Bn) and Y-o-Y Growth (%), 2014-2018
Figure 68: Fujifilm Holding Corporation Breakdown of Net Sales (%), by Segment, 2018-2019
Figure 69: CANON MEDICAL SYSTEMS CORPORATION (Canon Inc.) Revenue (US$ Mn) and Y-o-Y Growth (%), 2015–2018
Figure 70: CANON MEDICAL SYSTEMS CORPORATION (Canon Inc.) – Medical Systems Business Segment Breakdown of Net Sales (%), by Region, 2018
Figure 71: CANON MEDICAL SYSTEMS CORPORATION (Canon Inc.) Breakdown of Net Sales (%), by Business Segment, 2018
Figure 72: Danaher (Diagnostics) Revenue (US$ Mn) and Y-o-Y Growth (%), 2015-2019
Figure 73: Danaher (Diagnostics) Breakdown of Net Sales, by Region, 2019
Copyright © Transparency Market Research, Inc. All Rights reserved
Trust Online

Breast Imaging Market
