The management of neonatal jaundice amidst the COVID-19 pandemic has posed unique challenges for healthcare professionals. Hence, companies in the bilirubin meters market are increasing awareness about online follow-up programs to efficiently manage neonatal jaundice, which helps to reduce the stress on the already vulnerable state of healthcare systems. Since neonatal jaundice is associated with rapid progression in newborn infants, companies in the bilirubin meters market are encouraging healthcare professionals to adopt online follow-up programs that meet requirements of remote healthcare services for individuals, owing to the rampant spread of COVID-19.
Online follow-up programs are aiding in convenient monitoring of bilirubin levels in newborns. Neonates that are at a high risk of hyperbilirubinemia are gaining the focus of doctors who are adopting telehealth services to prevent the progression of bilirubin levels in infants.
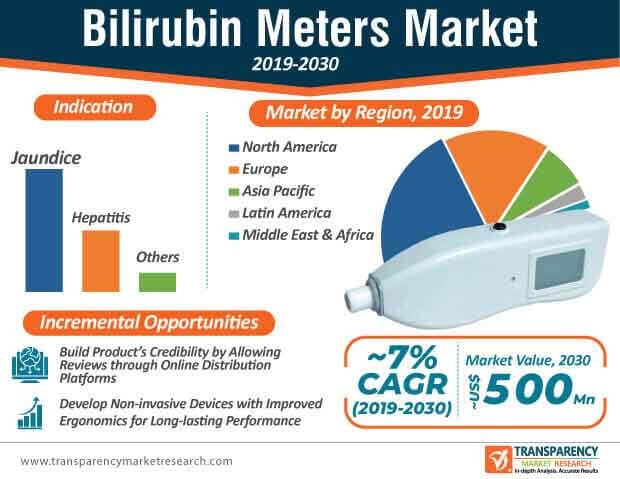
Non-invasive transcutaneous bilirubin meters are gaining popularity in the healthcare landscape. As such, the revenue of transcutaneous (hand-held) devices is predicted for exponential growth in the bilirubin meters market. For instance, Koninklijke Philips N.V.- a Dutch multinational conglomerate corporation headquartered in Amsterdam, is increasing its marketing potentials to target its device BiliChek for non-invasive jaundice assessment. Innovative devices are contributing for robust growth of the bilirubin meters market, which is estimated to ~US$ 500 Mn by 2030.
Due to the high risk of hyperbilirubinemia (newborn baby jaundice) in neonates, medtech companies in the bilirubin meters market are increasing their R&D capabilities to introduce non-invasive transcutaneous bilirubin meters. Non-invasive transcutaneous bilirubin meters are helping manufacturers gain global recognition, since these devices meet modern challenges of measuring serum bilirubin levels in patients. The use of disposable plastics in order to decrease the risk of infections due to contamination associated with multiple patient devices is bolstering the credibility of manufacturers.
The bilirubin meters market is estimated to register a healthy CAGR of ~7% during the forecast period. However, discrepancies in measurement of total serum bilirubin (TSB) using transcutaneous bilirubin (TcB) meters is emerging as a challenge for manufacturers in the bilirubin meters market. It has been found that TcB tends to underestimate TSB in neonates and adults with low melanin and overestimates TSB in individuals with high levels of skin melanin. Hence, medtech companies are increasing their R&D muscle for technological improvements in TcB devices and addressing issues of different racial groups.
In order to boost their credibility in the global market landscape, companies are increasing efforts to develop low-cost, point-of-care TcB devices that hold promising potentials for adoption in low- and middle-income countries. This is evident since Asia Pacific has many low- and middle-income countries and the region’s revenue is projected for exponential growth during the forecast period.
Product reviews and ratings are establishing transparency to validate the efficacy of bilirubin meters. For instance, medical device manufacturer, DAS Italy, is increasing awareness about its device NEO-BIL PLUS that aids in total analysis of bilirubin through a microcapillary tube. Companies in the bilirubin meters market are tapping into incremental opportunities through online sales and strengthening their supply chains to make their devices available worldwide. Innovative neonatal bilirubin meters are eliminating issues of frequent adjustments in devices.
Companies in the bilirubin meters market are increasing their production capabilities to innovate in non-invasive neonatal bilirubin meters. For instance, specialist in patient monitoring equipment Mennen Medical Ltd. is increasing efforts to increase availability of BiliCare System that aligns with the clinician’s needs in a newborn nursery, pediatrician’s office, and neonatal intensive care units (NICU). As such, non-invasive devices are gaining popularity to reduce the risk of infections in patients. Innovative non-invasive systems are streamlining the jaundice screening processes. Time efficiency of non-invasive neonatal bilirubin meters are replacing time-consuming processes of conducting blood draws in order to gain lab results.
Analysts’ Viewpoint
Online follow-up programs help in remote monitoring of neonates with hyperbilirubinemia to prevent further progression of bilirubin levels in infants amidst the COVID-19 lockdown. As such, non-invasive devices are a recurring trend in the bilirubin meters market. Med-tech companies are broadening their supply chains through online sales in order to gain global recognition.
Manufacturers are taking keen interest in improving the ergonomic design of devices to ensure long-lasting performance in medical applications. However, issues such as continuous standard resetting are emerging as barriers for market growth. Hence, companies should innovate in devices that eliminate the need for reagents in order to improve clinical outcomes.
Bilirubin meters market is projected to reach ~US$ 500 Mn by 2030
Bilirubin meters market to expand at a CAGR of ~7% from 2020 to 2030
Bilirubin meters market is driven by increase in demand for effective diagnosis of neonatal jaundice
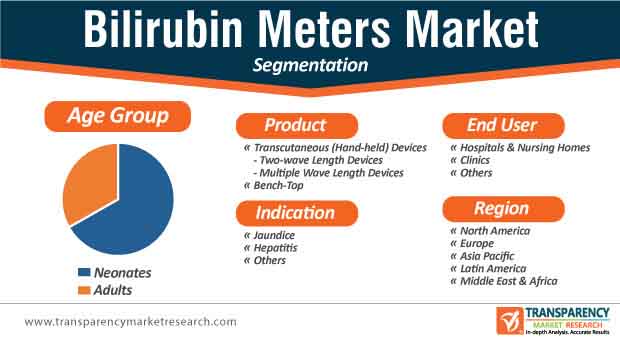
The transcutaneous (hand-held) devices segment dominated the global transcutaneous (hand-held) devices market, and the trend is projected to continue during the forecast period
Key players in the global bilirubin meters market include F. Hoffmann-La Roche Ltd., Koninklijke Philips N.V., Shenzhen Mindray Bio-Medical Electronics Co., Ltd, Siemens Healthineers AG, Drägerwerk AG & Co. KGaA
1. Preface
1.1. Market Definition and Scope
1.2. Market Segmentation
1.3. Key Research Objectives
1.4. Research Highlights
2. Assumptions and Research Methodology
3. Executive Summary : Global Bilirubin Meters Market
3.1. Market Overview
3.2. Introduction
3.3. Overview
3.4. Market Dynamics
3.4.1. Drivers
3.4.2. Restraints
3.4.3. Opportunities
3.5. Global Bilirubin Meters Market Analysis and Forecast, 2018–2030
4. Key Insights
4.1. Impact of COVID-19 Pandemic
4.2. Epidemiology Overview of Indicative Diseases
4.3. Porter’s Five Force Analysis
4.4. Health Care Overview
5. Global Bilirubin Meters Market Analysis and Forecast, by Product
5.1. Introduction & Definition
5.2. Key Findings / Developments
5.3. Global Bilirubin Meters Market Value Forecast, by Product, 2018–2030
5.3.1. Transcutaneous (Hand-held) Devices
5.3.1.1. Two-wave Length Devices
5.3.1.2. Multiple Wave Length Devices
5.3.2. Bench-Top
5.4. Global Bilirubin Meters Market Attractiveness, by Product
6. Global Bilirubin Meters Market Analysis and Forecast, by Age Group
6.1. Introduction & Definition
6.2. Key Findings / Developments
6.3. Market Value Forecast, by Age Group, 2018–2030
6.3.1. Neonates
6.3.2. Adults
6.4. Global Bilirubin Meters Market Attractiveness, by Age Group
7. Global Bilirubin Meters Market Analysis and Forecast, by Indication
7.1. Introduction & Definition
7.2. Key Findings / Developments
7.3. Global Bilirubin Meters Market Value Forecast, by Indication, 2018–2030
7.3.1. Jaundice
7.3.2. Hepatitis
7.3.3. Others
7.4. Global Bilirubin Meters Market Attractiveness, by Indication
8. Global Bilirubin Meters Market Analysis and Forecast, by End-user
8.1. Introduction & Definition
8.2. Key Findings / Developments
8.3. Global Bilirubin Meters Market Value Forecast, by End-user, 2018–2030
8.3.1. Hospitals & Nursing Home
8.3.2. Clinics
8.3.3. Others
8.4. Global Bilirubin Meters Market Attractiveness, by End-user
9. Global Bilirubin Meters Market Analysis and Forecast, by Region
9.1. Key Findings
9.2. Global Bilirubin Meters Market Value Forecast, by Region
9.2.1. North America
9.2.2. Europe
9.2.3. Asia Pacific
9.2.4. Latin America
9.2.5. Middle East & Africa
9.3. Global Bilirubin Meters Market Attractiveness, by Region
10. North America Bilirubin Meters Market Analysis and Forecast
10.1. Introduction
10.2. North America Bilirubin Meters Market Value Forecast, by Product, 2018–2030
10.2.1. Transcutaneous (Hand-held) Devices
10.2.1.1. Two-wave Length Devices
10.2.1.2. Multiple Wave Length Devices
10.2.2. Bench-Top
10.3. North America Bilirubin Meters Market Value Forecast, by Age Group, 2018–2030
10.3.1. Neonates
10.3.2. Adults
10.4. North America Bilirubin Meters Market Value Forecast, by Indication, 2018–2030
10.4.1. Jaundice
10.4.2. Hepatitis
10.4.3. Others
10.5. North America Bilirubin Meters Market Value Forecast, by End-user, 2018–2030
10.5.1. Hospitals & Nursing Home
10.5.2. Clinics
10.5.3. Others
10.6. North America Bilirubin Meters Market Value Forecast, by Country, 2018–2030
10.6.1. U.S.
10.6.2. Canada
10.7. North America Bilirubin Meters Market Attractiveness Analysis
10.7.1. By Product
10.7.2. By Age Group
10.7.3. By Indication
10.7.4. By End-user
10.7.5. By Country
11. Europe Bilirubin Meters Market Analysis and Forecast
11.1. .Introduction
11.2. Europe Bilirubin Meters Market Value Forecast, by Product, 2018–2030
11.2.1. Transcutaneous (Hand-held) Devices
11.2.1.1. Two-wave Length Devices
11.2.1.2. Multiple Wave Length Devices
11.2.2. Bench-Top
11.3. Europe Bilirubin Meters Market Value Forecast, by Age Group, 2018–2030
11.3.1. Neonates
11.3.2. Adults
11.4. Europe Bilirubin Meters Market Value Forecast, by Indication, 2018–2030
11.4.1. Jaundice
11.4.2. Hepatitis
11.4.3. Others
11.5. Europe Bilirubin Meters Market Value Forecast, by End-user, 2018–2030
11.5.1. Hospitals & Nursing Home
11.5.2. Clinics
11.5.3. Others
11.6. Europe Bilirubin Meters Market Value Forecast, by Country/Sub-region, 2018–2030
11.6.1. Germany
11.6.2. U.K.
11.6.3. France
11.6.4. Spain
11.6.5. Italy
11.6.6. Rest of Europe
11.7. Europe Bilirubin Meters Market Attractiveness Analysis
11.7.1. By Product
11.7.2. By Age Group
11.7.3. By Indication
11.7.4. By End-user
11.7.5. By Country/Sub-region
12. Asia Pacific Bilirubin Meters Market Analysis and Forecast
12.1. Introduction
12.2. Asia Pacific Bilirubin Meters Market Value Forecast, by Product, 2018–2030
12.2.1. Transcutaneous (Hand-held) Devices
12.2.1.1. Two-wave Length Devices
12.2.1.2. Multiple Wave Length Devices
12.2.2. Bench-Top
12.3. Asia Pacific Bilirubin Meters Market Value Forecast, by Age Group, 2018–2030
12.3.1. Neonates
12.3.2. Adults
12.4. Asia Pacific Bilirubin Meters Market Value Forecast, by Indication, 2018–2030
12.4.1. Jaundice
12.4.2. Hepatitis
12.4.3. Others
12.5. Asia Pacific Bilirubin Meters Market Value Forecast, by End-user, 2018–2030
12.5.1. Hospitals & Nursing Home
12.5.2. Clinics
12.5.3. Others
12.6. Asia Pacific Bilirubin Meters Market Value Forecast, by Country/Sub-region, 2018–2030
12.6.1. China
12.6.2. Japan
12.6.3. India
12.6.4. Australia & New Zealand
12.7. Rest of Asia Pacific
12.8. Asia Pacific Bilirubin Meters Market Attractiveness Analysis
12.8.1. By Product
12.8.2. By Age Group
12.8.3. By Indication
12.8.4. By End-user
12.8.5. By Country/Sub-region
13. Latin America Bilirubin Meters Market Analysis and Forecast
13.1. Introduction
13.2. Latin America Bilirubin Meters Market Value Forecast, by Product, 2018–2030
13.2.1. Transcutaneous (Hand-held) Devices
13.2.1.1. Two-wave Length Devices
13.2.1.2. Multiple Wave Length Devices
13.2.2. Bench-Top
13.3. Latin America Bilirubin Meters Market Value Forecast, by Age Group, 2018–2030
13.3.1. Neonates
13.3.2. Adults
13.4. Latin America Bilirubin Meters Market Value Forecast, by Indication, 2018–2030
13.4.1. Jaundice
13.4.2. Hepatitis
13.4.3. Others
13.5. Latin America Bilirubin Meters Market Value Forecast, by End-user, 2018–2030
13.5.1. Hospitals & Nursing Home
13.5.2. Clinics
13.5.3. Others
13.6. Latin America Bilirubin Meters Market Value Forecast, by Country/Sub-region, 2018–2030
13.6.1. Brazil
13.6.2. Mexico
13.6.3. Rest of Latin America
13.7. Latin America Bilirubin Meters Market Attractiveness Analysis
13.7.1. By Product
13.7.2. By Age Group
13.7.3. By Indication
13.7.4. By End-user
13.7.5. By Country/Sub-region
14. Middle East & Africa Bilirubin Meters Market Analysis and Forecast
14.1. Introduction
14.2. Middle East & Africa Bilirubin Meters Market Value Forecast, by Product, 2018–2030
14.2.1. Transcutaneous (Hand-held) Devices
14.2.1.1. Two-wave Length Devices
14.2.1.2. Multiple Wave Length Devices
14.2.2. Bench-Top
14.3. Middle East & Africa Bilirubin Meters Market Value Forecast, by Age Group, 2018–2030
14.3.1. Neonates
14.3.2. Adults
14.4. Middle East & Africa Bilirubin Meters Market Value Forecast, by Indication, 2018–2030
14.4.1. Jaundice
14.4.2. Hepatitis
14.4.3. Others
14.5. Middle East & Africa Bilirubin Meters Market Value Forecast, by End-user, 2018–2030
14.5.1. Hospitals & Nursing Home
14.5.2. Clinics
14.5.3. Others
14.6. Middle East & Africa Bilirubin Meters Market Value Forecast, by Country/Sub-region, 2018–2030
14.6.1. GCC Countries
14.6.2. South Africa
14.6.3. Rest of Middle East & Africa
14.7. Middle East & Africa Bilirubin Meters Market Attractiveness Analysis
14.7.1. By Product
14.7.2. By Age Group
14.7.3. By Indication
14.7.4. By End-user
14.7.5. By Country/Sub-region
15. Company Profiles
15.1. F. Hoffmann-La Roche Ltd.
15.1.1.1. Company Overview
15.1.1.2. Company Financials
15.1.1.3. Growth Strategies
15.1.1.4. SWOT Analysis
15.2. Koninklijke Philips N.V.
15.2.1.1. Company Overview
15.2.1.2. Company Financials
15.2.1.3. Growth Strategies
15.2.1.4. SWOT Analysis
15.3. Shenzhen Mindray Bio-Medical Electronics Co., Ltd
15.3.1.1. Company Overview
15.3.1.2. Company Financials
15.3.1.3. Growth Strategies
15.3.1.4. SWOT Analysis
15.4. Siemens Healthineers AG
15.4.1.1. Company Overview
15.4.1.2. Company Financials
15.4.1.3. Growth Strategies
15.4.1.4. SWOT Analysis
15.5. Drägerwerk AG & Co. KGaA
15.5.1.1. Company Overview
15.5.1.2. Company Financials
15.5.1.3. Growth Strategies
15.5.1.4. SWOT Analysis
15.6. Zhengzhou Dison Instrument And Meter Co., Ltd.
15.6.1.1. Company Overview
15.6.1.2. Growth Strategies
15.6.1.3. SWOT Analysis
15.7. Mennen Medical Ltd.
15.7.1.1. Company Overview
15.7.1.2. Growth Strategies
15.7.1.3. SWOT Analysis
15.8. Natus Medical Incorporated
15.8.1.1. Company Overview
15.8.1.2. Growth Strategies
15.8.1.3. SWOT Analysis
15.9. Ningbo David Medical Device Co., Ltd
15.9.1.1. Company Overview
15.9.1.2. Growth Strategies
15.9.1.3. SWOT Analysis
15.10. Micro Lab Instruments
15.10.1.1. Company Overview
15.10.1.2. Growth Strategies
15.10.1.3. SWOT Analysis
15.11. APEL Co., Ltd.
15.11.1.1. Company Overview
15.11.1.2. Growth Strategies
15.11.1.3. SWOT Analysis
15.12. Avihealthcare
15.12.1.1. Company Overview
15.12.1.2. Growth Strategies
15.12.1.3. SWOT Analysis
List of Tables
Table 01: Global Bilirubin Meters Market Value (US$ Mn) Forecast, by Product, 2018–2030
Table 02: Global Bilirubin Meters Market Value (US$ Mn) Forecast, by Age Group, 2018–2030
Table 03: Global Bilirubin Meters Market Value (US$ Mn) Forecast, by Indication, 2018–2030
Table 04: Global Bilirubin Meters Market Value (US$ Mn) Forecast, by End-user, 2018–2030
Table 05: Global Bilirubin Meters Market Value (US$ Mn) Forecast, by Region, 2018–2030
Table 06: North America Bilirubin Meters Market Value (US$ Mn) Forecast, by Product, 2018–2030
Table 07: North America Bilirubin Meters Market Value (US$ Mn) Forecast, by Age Group, 2018–2030
Table 08: North America Bilirubin Meters Market Value (US$ Mn) Forecast, by Indication, 2018–2030
Table 09: North America Bilirubin Meters Market Value (US$ Mn) Forecast, by End-user, 2018–2030
Table 10: North America Bilirubin Meters Market Value (US$ Mn) Forecast, by Country, 2018–2030
Table 11: Europe Bilirubin Meters Market Value (US$ Mn) Forecast, by Product, 2018–2030
Table 12: Europe Bilirubin Meters Market Value (US$ Mn) Forecast, by Age Group, 2018–2030
Table 13: Europe Bilirubin Meters Market Value (US$ Mn) Forecast, by Indication, 2018–2030
Table 14: Europe Bilirubin Meters Market Value (US$ Mn) Forecast, by End-user, 2018–2030
Table 15: Europe Bilirubin Meters Market Value (US$ Mn) Forecast, by Country/Sub-region, 2018–2030
Table 16: Asia Pacific Bilirubin Meters Market Value (US$ Mn) Forecast, by Product, 2018–2030
Table 17: Asia Pacific Bilirubin Meters Market Value (US$ Mn) Forecast, by Age Group, 2018–2030
Table 18: Asia Pacific Bilirubin Meters Market Value (US$ Mn) Forecast, by Indication, 2018–2030
Table 19: Asia Pacific Bilirubin Meters Market Value (US$ Mn) Forecast, by End-user, 2018–2030
Table 20: Asia Pacific Bilirubin Meters Market Value (US$ Mn) Forecast, by Country/Sub-region, 2018–2030
Table 21: Latin America Bilirubin Meters Market Value (US$ Mn) Forecast, by Product, 2018–2030
Table 22: Latin America Bilirubin Meters Market Value (US$ Mn) Forecast, by Age Group, 2018–2030
Table 23: Latin America Bilirubin Meters Market Value (US$ Mn) Forecast, by Indication, 2018–2030
Table 24: Latin America Bilirubin Meters Market Value (US$ Mn) Forecast, by End-user, 2018–2030
Table 25: Latin America Bilirubin Meters Market Value (US$ Mn) Forecast, by Country/Sub-region, 2018–2030
Table 26: Middle East & Africa Bilirubin Meters Market Value (US$ Mn) Forecast, by Product, 2018–2030
Table 27: Middle East & Africa Bilirubin Meters Market Size (US$ Mn) Forecast, by Age Group, 2018–2030
Table 28: Middle East & Africa Bilirubin Meters Market Value (US$ Mn) Forecast, by Indication, 2018–2030
Table 29: Middle East & Africa Bilirubin Meters Market Value (US$ Mn) Forecast, by End-user, 2018–2030
Table 30: Middle East & Africa Bilirubin Meters Market Value (US$ Mn) Forecast, by Country/Sub-region, 2018–2030
List of Figures
Figure 01: Global Bilirubin Meters Market Value (US$ Mn) and Distribution, by Region, 2019 and 2030
Figure 02: Global Bilirubin Meters Market Value (US$ Mn) Forecast, 2018–2030
Figure 03: Global Bilirubin Meters Market Value Share, by Product, 2019
Figure 04: Global Bilirubin Meters Market Value Share, by Age Group, 2019
Figure 05: Global Bilirubin Meters Market Value Share, by Indication, 2019
Figure 06: Global Bilirubin Meters Market Value Share, by End-user, 2019
Figure 07: Global Bilirubin Meters Market Value Share Analysis, by Product, 2019 and 2030
Figure 08: Global Bilirubin Meters Market Attractiveness Analysis, by Product
Figure 09: Global Bilirubin Meters Market Value (US$ Mn) and Y-o-Y Growth (%), by Transcutaneous (Hand-held) Devices, 2018–2030
Figure 10: Global Bilirubin Meters Market Value (US$ Mn) and Y-o-Y Growth (%), by Bench-Top Analyzers, 2018–2030
Figure 11: Global Bilirubin Meters Market Value Share Analysis, by Age Group, 2019 and 2030
Figure 12: Global Bilirubin Meters Market Attractiveness Analysis, by Age Group
Figure 13: Global Bilirubin Meters Market Value (US$ Mn) and Y-o-Y Growth (%), by Neonates, 2018–2030
Figure 14: Global Bilirubin Meters Market Value (US$ Mn) and Y-o-Y Growth (%), by Adults, 2018–2030
Figure 15: Global Bilirubin Meters Market Value Share Analysis, by Indication, 2019 and 2030
Figure 16: Global Bilirubin Meters Market Attractiveness Analysis, by Indication
Figure 17: Global Bilirubin Meters Market Value (US$ Mn) and Y-o-Y Growth (%), by Jaundice, 2018–2030
Figure 18: Global Bilirubin Meters Market Value (US$ Mn) and Y-o-Y Growth (%), by Hepatitis, 2018–2030
Figure 19: Global Bilirubin Meters Market Value (US$ Mn) and Y-o-Y Growth (%), by Others, 2018–2030
Figure 20: Global Bilirubin Meters Market Value Share Analysis, by End-user, 2019 and 2030
Figure 21: Global Bilirubin Meters Market Attractiveness Analysis, by End-user
Figure 22: Global Bilirubin Meters Market Value (US$ Mn) and Y-o-Y Growth (%), by Hospitals & Nursing Home, 2018–2030
Figure 23: Global Bilirubin Meters Market Value (US$ Mn) and Y-o-Y Growth (%), by Clinics, 2018–2030
Figure 24: Global Bilirubin Meters Market Value (US$ Mn) and Y-o-Y Growth (%), by Others, 2018–2030
Figure 25: Global Bilirubin Meters Market Value Share Analysis, by Region, 2019 and 2030
Figure 26: Global Bilirubin Meters Market Attractiveness Analysis, by Region
Figure 27: North America Bilirubin Meters Market Value (US$ Mn) Forecast and Y-o-Y Growth (%) Projection, 2018–2030
Figure 28: North America Bilirubin Meters Market Attractiveness Analysis, by Product, 2019 and 2030
Figure 29: North America Bilirubin Meters Market Value Share Analysis, by Product, 2020–2030
Figure 30: North America Bilirubin Meters Market Attractiveness Analysis, by Age Group, 2019 and 2030
Figure 31: North America Bilirubin Meters Market Value Share Analysis, by Age Group, 2020–2030
Figure 32: North America Bilirubin Meters Market Attractiveness Analysis, by Indication, 2019 and 2030
Figure 33: North America Bilirubin Meters Market Value Share Analysis, by Indication, 2020–2030
Figure 34: North America Bilirubin Meters Market Attractiveness Analysis, by End-user, 2019 and 2030
Figure 35: North America Bilirubin Meters Market Value Share Analysis, by End-user, 2020–2030
Figure 36: North America Bilirubin Meters Market Value Share Analysis, by Country, 2019 and 2030
Figure 37: North America Bilirubin Meters Market Attractiveness Analysis, by Country, 2020–2030
Figure 38: Europe Bilirubin Meters Market Value (US$ Mn) Forecast and Y-o-Y Growth (%) Projection, 2018–2030
Figure 39: Europe Bilirubin Meters Market Attractiveness Analysis, by Product, 2019 and 2030
Figure 40: Europe Bilirubin Meters Market Value Share Analysis, by Product, 2020–2030
Figure 41: Europe Bilirubin Meters Market Attractiveness Analysis, by Age Group, 2019 and 2030
Figure 42: Europe Bilirubin Meters Market Value Share Analysis, by Age Group, 2020–2030
Figure 43: Europe Bilirubin Meters Market Attractiveness Analysis, by Indication, 2019 and 2030
Figure 44: Europe Bilirubin Meters Market Value Share Analysis, by Indication, 2020–2030
Figure 45: Europe Bilirubin Meters Market Attractiveness Analysis, by End-user, 2019 and 2030
Figure 46: Europe Bilirubin Meters Market Value Share Analysis, by End-user, 2020–2030
Figure 47: Europe Bilirubin Meters Market Value Share Analysis, by Country/Sub-region, 2019 and 2030
Figure 48: Europe Bilirubin Meters Market Attractiveness Analysis, by Country/Sub-region, 2020–2030
Figure 49: Asia Pacific Bilirubin Meters Market Value (US$ Mn) Forecast and Y-o-Y Growth (%) Projection, 2018–2030
Figure 50: Asia Pacific Bilirubin Meters Market Attractiveness Analysis, by Product
Figure 51: Asia Pacific Bilirubin Meters Market Value Share Analysis, by Product, 2019 and 2030
Figure 52: Asia Pacific Bilirubin Meters Market Attractiveness Analysis, by Age Group
Figure 53: Asia Pacific Bilirubin Meters Market Value Share Analysis, by Age Group, 2019 and 2030
Figure 54: Asia Pacific Bilirubin Meters Market Attractiveness Analysis, by Indication
Figure 55: Asia Pacific Bilirubin Meters Market Value Share Analysis, by Indication, 2019 and 2030
Figure 56: Asia Pacific Bilirubin Meters Market Attractiveness Analysis, by End-user
Figure 57: Asia Pacific Bilirubin Meters Market Value Share Analysis, by End-user, 2019 and 2030
Figure 58: Asia Pacific Bilirubin Meters Market Value Share Analysis, by Country/Sub-region, 2019 and 2030
Figure 59: Asia Pacific Bilirubin Meters Market Attractiveness Analysis, by Country/Sub-region, 2020–2030
Figure 60: Latin America Bilirubin Meters Market Value (US$ Mn) Forecast and Y-o-Y Growth (%) Projection, 2018–2030
Figure 61: Latin America Bilirubin Meters Market Attractiveness Analysis, by Product
Figure 62: Latin America Bilirubin Meters Market Value Share Analysis, by Product, 2019 and 2030
Figure 63: Latin America Bilirubin Meters Market Attractiveness Analysis, by Age Group
Figure 64: Latin America Bilirubin Meters Market Value Share Analysis, by Age Group, 2019 and 2030
Figure 65: Latin America Bilirubin Meters Market Attractiveness Analysis, by Indication
Figure 66: Latin America Bilirubin Meters Market Value Share Analysis, by Indication, 2019 and 2030
Figure 67: Latin America Bilirubin Meters Market Attractiveness Analysis, by End-user
Figure 68: Latin America Bilirubin Meters Market Value Share Analysis, by End-user, 2019 and 2030
Figure 69: Latin America Bilirubin Meters Market Value Share Analysis, by Country/Sub-region, 2019 and 2030
Figure 70: Latin America Bilirubin Meters Market Attractiveness Analysis, by Country/Sub-region, 2020–2030
Figure 71: Middle East & Africa Bilirubin Meters Market Value (US$ Mn) Forecast and Y-o-Y Growth (%) Projection, 2018–2030
Figure 72: Middle East & Africa Bilirubin Meters Market Attractiveness Analysis, by Product
Figure 73: Middle East & Africa Bilirubin Meters Market Value Share Analysis, by Product, 2019 and 2030
Figure 74: Middle East & Africa Bilirubin Meters Market Attractiveness Analysis, by Age Group
Figure 75: Middle East & Africa Bilirubin Meters Market Value Share Analysis, by Age Group, 2019 and 2030
Figure 76: Middle East & Africa Bilirubin Meters Market Attractiveness Analysis, by Indication
Figure 77: Middle East & Africa Bilirubin Meters Market Value Share Analysis, by Indication, 2019 and 2030
Figure 78: Middle East & Africa Bilirubin Meters Market Attractiveness Analysis, by End-user
Figure 79: Middle East & Africa Bilirubin Meters Market Value Share Analysis, by End-user, 2019 and 2030
Figure 80: Middle East & Africa Bilirubin Meters Market Value Share Analysis, by Country/Sub-region, 2019 and 2030
Figure 81: Middle East & Africa Bilirubin Meters Market Attractiveness Analysis, by Country/Sub-region, 2020–2030
Copyright © Transparency Market Research, Inc. All Rights reserved
Trust Online

Bilirubin Meters Market
