Bag-in-box containers are used as convenient packaging solutions for packaging products such as, food & beverages, household, and industrial liquid products. Bag-in-box containers provide extra protection during transportation and can carry and package liquids efficiently. It is light in weight and helps in reduction in space during the process of storage and transportation. The demand for customized packaging is increasing due to the production of novel and variety of products. In addition, the growing trend of the use of high-quality and attractive printed packs to grab the attention of consumers has led to the growth of the bag-in-box container market. The demand for alternatives for plastic packaging containers for environmental reasons has projected the growth of the bag-in-box container market. The global bag-in-box container market is estimated to expand at a CAGR of 5% during the forecast period of 2019-2027.
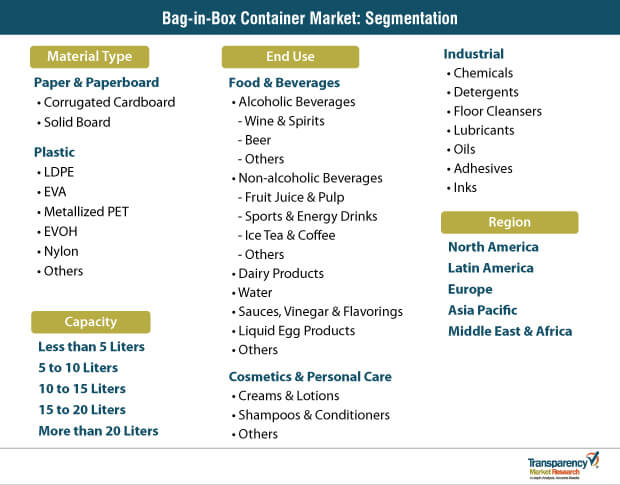
The global bag-in-box container market is segmented into food & beverages, household products, and industrial liquid products. The food & beverages segment is further classified into alcoholic and non-alcoholic beverages. The global bag-in-box container market is gaining traction due to rising demand from the wine industry. The box-in-box containers are used for wine packaging as they are convenient to use and distribute. Additionally, they are cost-effective too. The oxygen transmission rate (OTR) of packaging determines the overall quality of wine and box-in-box containers offer low transmission on the rate. Thus, box-in-box containers market has exhibited substantial growth in the alcoholic beverages segment. Further, the bag-in-box containers are light weighted and can be transported easily and increasing its shelf life and decreasing the wastage of product. Also, the high barrier films used in the bag-in-box containers help keep the food fresh and increase its shelf life. These attributes have scaled the sales. In accordance with it, the market recorded massive sales of 870 thousand tons and reached the valuation of US$2.9 bn.
Rapid urbanization and population has increased the demand for household items, such as surface cleaners, dishwashers, and others. Taking into consideration, the growing demand for bag-in-box containers in these household products, the bag-in-box container market is forecasted to exhibit significant growth during the forecast period of 2019-2027.
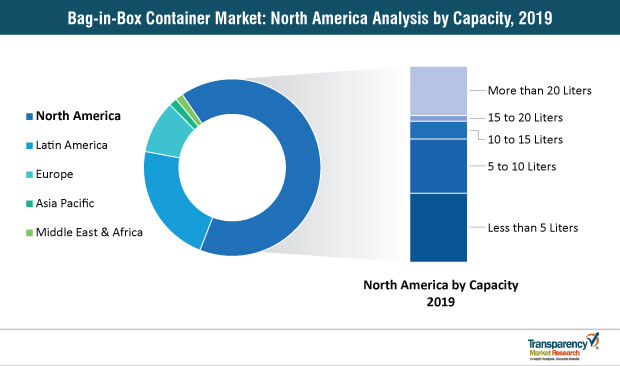
The market in Europe is projected to witness a prominent revenue share of the global market during the forecast period of 2019-2027. Countries such as Italy, the U.K, France, and Sweden are expected to contribute towards the growth of the bag-in-box market owing to, the rising demand for bag-in-box containers by wine manufacturers. North America is a lucrative bag-in-box market followed by the Asia Pacific. Rapid urbanization and industrialization are focusing on different types of packaging in bag-in-box containers. Major countries such as India and China have shown a rise in their disposable income and purchasing capacity of individuals. This aspect has propelled the growth of the bag-in-box market.
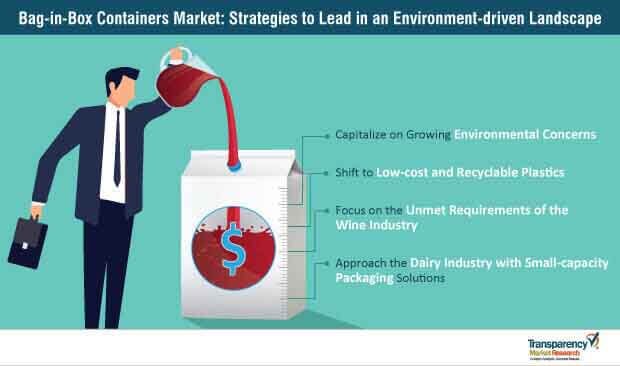
According to TMR studies, with reference to Environment Impact Assessment (EIA), the carbon-di-oxide emissions during the manufacturing of bag-in-box containers is eight times less than other packaging materials. The increasing awareness about carbon emissions is promoting the use of eco-friendly and green products has boosted the growth of the bag-in-box market. The wine producers are exploring new technologies to increase manufacturing efficiency. Various companies such as, Sutter Homes, Virginia Wine works are substituting existing brands with bag-in-box containers.
The competitors are indulging in strategies to maintain their dominance in the bag-in-box market. The lucrative opportunities in the dairy and juice industry are predicted to augment the growth of the bag-in-box market. The leading market players functional in the global bag-in-box market are namely, TPS Rental Systems Ltd., Vine Valley Ventures LLC, Liqui-Box, Scholle IPN, CDF Corporation, Amcor Limited, Liqui-Box, and Smurfit Kappa Group
Bag-in-Box Containers Market is projected to reach US $4.5 Bn by 2027
Bag-in-Box Containers Market is expected to grow at a CAGR of 5% during 2019 - 2027
Bag-in-Box Containers Market is studied from 2019 - 2027
Key vendors in the Bag-in-Box Containers Market are Smurfit Kappa Group, DS Smith, Amcor Limited, Liqui-Box, Scholle IPN, CDF Corporation, Vine Valley Ventures LLC, Parish Manufacturing Inc., TPS Rental Systems Ltd., and Optopack Ltd. among others.
Europe region Takes Lead in the Bag-in-Box Containers Market
1. Executive Summary
1.1. Market Overview
1.2. Market Analysis
1.3. TMR Analysis and Recommendations
1.4. Wheel of Opportunity
2. Market Introduction
2.1. Market Definition
2.2. Market Taxonomy
3. Market Viewpoint
3.1. Global Packaging Industry Overview
3.2. Product Innovation and Trends
3.3. Macroeconomic Indicators & Correlation Analysis
3.3.1. Gross Domestic Product
3.3.2. Manufacturing Value Added
3.3.3. Parent Market Overview
3.3.4. End Use Industry Analysis
3.4. Forecast Factors
3.5. Porter’s Analysis
3.5.1. Threat of New Entrants
3.5.2. Bargaining Power of Buyers
3.5.3. Bargaining Power of Suppliers
3.5.4. Threat of Substitutes
3.5.5. Competitive Rivalry
3.6. Value Chain Analysis
3.6.1. Key Participants
3.6.1.1.1. Raw Material Suppliers
3.6.1.1.2. Bag-in-Box Containers Manufacturers
3.6.1.1.3. Distributors
3.6.2. Profitability Margin
3.7. Market Dynamics
3.7.1. Drivers
3.7.1.1. Supply Side
3.7.1.2. Demand Side
3.7.2. Restraints
3.7.3. Opportunities
4. Global Bag-in-Box Containers Market Analysis
4.1. Market Value (US$ Mn) and Volume (Tons) Analysis & Forecast
4.2. Y-o-Y Growth Projections
4.3. Absolute $ Opportunity Analysis
5. Global Bag-in-Box Containers Market Analysis and Forecast, By Material Type
5.1. Section Summary
5.2. Introduction
5.2.1. Basis Point Share (BPS) Analysis By Material Type
5.2.2. Y-o-Y Growth Projections By Material Type
5.3. Market Value (US$ Mn) and Volume (Tons) Historical Analysis 2014-2018 and Forecast 2019-2027, By Material Type
5.3.1. Paper/Paperboard
5.3.1.1. Corrugated Cardboard
5.3.1.2. Solid Board
5.3.2. Plastic
5.3.2.1. Low-density polyethylene (LDPE)
5.3.2.2. Ethylene Vinyl Acetate
5.3.2.3. Metallized Polyethylene Terephthalate
5.3.2.4. Ethylene Vinyl Alcohol
5.3.2.5. Nylon
5.3.2.6. Others
5.4. Market Attractiveness Analysis By Material Type
5.5. Prominent Trends
6. Global Bag-in-Box Containers Market Analysis and Forecast, By Capacity
6.1. Section Summary
6.2. Introduction
6.2.1. Basis Point Share (BPS) Analysis By Capacity
6.2.2. Y-o-Y Growth Projections By Capacity
6.3. Market Value (US$ Mn) and Volume (Tons) Historical Analysis 2014-2018 and Forecast 2019-2027, By Capacity
6.3.1. Less than 5.0 liters
6.3.2. 5.0 – 10.0 liters
6.3.3. 10.0 - 15.0 liters
6.3.4. 15.0 – 20.0 liters
6.3.5. More than 20.0 liters
6.4. Market Attractiveness Analysis By Capacity
6.5. Prominent Trends
7. Global Bag-in-Box Containers Market Analysis and Forecast, By End-Use
7.1. Section Summary
7.2. Introduction
7.2.1. Basis Point Share (BPS) Analysis By End-Use
7.2.2. Y-o-Y Growth Projections By End-Use
7.3. Market Value (US$ Mn) and Volume (Tons) Historical Analysis 2014-2018 and Forecast 2019-2027, By End-Use
7.3.1. Food & Beverages
7.3.1.1. Alcoholic Beverages
7.3.1.1.1. Wine & Spirits
7.3.1.1.2. Beer
7.3.1.1.3. Others
7.3.1.2. Non-Alcoholic Beverages
7.3.1.2.1. Fruit Juices
7.3.1.2.2. Sports & Energy Drinks
7.3.1.2.3. Ice Tea & Coffee
7.3.1.2.4. Others
7.3.1.3. Dairy Products
7.3.1.4. Water
7.3.1.5. Sauces, Vinegar & Flavoring
7.3.1.6. Liquid Egg Products
7.3.1.7. Others
7.3.2. Industrial
7.3.2.1. Chemicals
7.3.2.2. Detergents
7.3.2.3. Floor Cleansers
7.3.2.4. Lubricants
7.3.2.5. Oils
7.3.2.6. Adhesives
7.3.2.7. Inks
7.3.3. Cosmetics & Personal Care
7.3.3.1. Creams & Lotions
7.3.3.2. Shampoo & Conditioner
7.3.3.3. Others
7.4. Market Attractiveness Analysis By End-Use
7.5. Prominent Trends
8. Global Bag-in-Box Containers Market Analysis and Forecast, By Region
8.1. Section Summary
8.2. Introduction
8.2.1. Basis Point Share (BPS) Analysis By Region
8.2.2. Y-o-Y Growth Projections By Region
8.3. Market Value (US$ Mn) and Volume (Tons) Historical Analysis 2014-2018 and Forecast 2019-2027, By Region
8.3.1. North America
8.3.2. Latin America
8.3.3. Europe
8.3.4. Asia Pacific (APAC)
8.3.5. Middle East & Africa (MEA)
8.4. Market Attractiveness Analysis By Region
8.5. Prominent Trends
9. North America Bag-in-Box Containers Market Analysis and Forecast
9.1. Introduction
9.2. Pricing Analysis
9.3. Key Trends
9.4. Key Regulations
9.5. Market Value (US$ Mn) and Volume (Tons) Historical Analysis 2014-2018 and Forecast 2019-2027, By Country
9.5.1. U.S.
9.5.2. Canada
9.6. Market Value (US$ Mn) and Volume (Tons) Historical Analysis 2014-2018 and Forecast 2019-2027, By Material Type
9.6.1. Paper/Paperboard
9.6.1.1. Corrugated Cardboard
9.6.1.2. Solid Board
9.6.2. Plastic
9.6.2.1. Low-density polyethylene (LDPE)
9.6.2.2. Ethylene Vinyl Acetate
9.6.2.3. Metallized Polyethylene Terephthalate
9.6.2.4. Ethylene Vinyl Alcohol
9.6.2.5. Nylon
9.6.2.6. Others
9.7. Market Value (US$ Mn) and Volume (Tons) Historical Analysis 2014-2018 and Forecast 2019-2027, By Capacity
9.7.1. Less than 5.0 liters
9.7.2. 5.0 – 10.0 liters
9.7.3. 10.0 - 15.0 liters
9.7.4. 15.0 – 20.0 liters
9.7.5. More than 20.0 liters
9.8. Market Value (US$ Mn) and Volume (Tons) Historical Analysis 2014-2018 and Forecast 2019-2027, By End-Use
9.8.1. Food & Beverages
9.8.1.1. Alcoholic Beverages
9.8.1.1.1. Wine & Spirits
9.8.1.1.2. Beer
9.8.1.1.3. Others
9.8.1.2. Non-Alcoholic Beverages
9.8.1.2.1. Fruit Juices
9.8.1.2.2. Sports & Energy Drinks
9.8.1.2.3. Ice Tea & Coffee
9.8.1.2.4. Others
9.8.1.3. Dairy Products
9.8.1.4. Water
9.8.1.5. Sauces, Vinegar & Flavoring
9.8.1.6. Liquid Egg Products
9.8.1.7. Others
9.8.2. Industrial
9.8.2.1. Chemicals
9.8.2.2. Detergents
9.8.2.3. Floor Cleansers
9.8.2.4. Lubricants
9.8.2.5. Oils
9.8.2.6. Adhesives
9.8.2.7. Inks
9.8.3. Cosmetics & Personal Care
9.8.3.1. Creams & Lotions
9.8.3.2. Shampoo & Conditioner
9.8.3.3. Others
9.9. Market Attractiveness Analysis
9.9.1. By Country
9.9.2. By Material Type
9.9.3. By Capacity
9.9.4. By End-Use
9.10. Market Trends
9.11. Key Representative Market Participants
9.12. Key Market Participants – Intensity Mapping
9.13. Drivers and Restraints – Impact Analysis
10. Latin America Bag-in-Box Containers Market Analysis and Forecast
10.1. Introduction
10.2. Pricing Analysis
10.3. Key Trends
10.4. Key Regulations
10.5. Market Value (US$ Mn) and Volume (Tons) Historical Analysis 2014-2018 and Forecast 2019-2027, By Country
10.5.1. Brazil
10.5.2. Mexico
10.5.3. Argentina
10.5.4. Rest of Latin America
10.6. Market Value (US$ Mn) and Volume (Tons) Historical Analysis 2014-2018 and Forecast 2019-2027, By Material Type
10.6.1. Paper/Paperboard
10.6.1.1. Corrugated Cardboard
10.6.1.2. Solid Board
10.6.2. Plastic
10.6.2.1. Low-density polyethylene (LDPE)
10.6.2.2. Ethylene Vinyl Acetate
10.6.2.3. Metallized Polyethylene Terephthalate
10.6.2.4. Ethylene Vinyl Alcohol
10.6.2.5. Nylon
10.6.2.6. Others
10.7. Market Value (US$ Mn) and Volume (Tons) Historical Analysis 2014-2018 and Forecast 2019-2027, By Capacity
10.7.1. Less than 5.0 liters
10.7.2. 5.0 – 10.0 liters
10.7.3. 10.0 - 15.0 liters
10.7.4. 15.0 – 20.0 liters
10.7.5. More than 20.0 liters
10.8. Market Value (US$ Mn) and Volume (Tons) Historical Analysis 2014-2018 and Forecast 2019-2027, By End-Use
10.8.1. Food & Beverages
10.8.1.1. Alcoholic Beverages
10.8.1.1.1. Wine & Spirits
10.8.1.1.2. Beer
10.8.1.1.3. Others
10.8.1.2. Non-Alcoholic Beverages
10.8.1.2.1. Fruit Juices
10.8.1.2.2. Sports & Energy Drinks
10.8.1.2.3. Ice Tea & Coffee
10.8.1.2.4. Others
10.8.1.3. Dairy Products
10.8.1.4. Water
10.8.1.5. Sauces, Vinegar & Flavoring
10.8.1.6. Liquid Egg Products
10.8.1.7. Others
10.8.2. Industrial
10.8.2.1. Chemicals
10.8.2.2. Detergents
10.8.2.3. Floor Cleansers
10.8.2.4. Lubricants
10.8.2.5. Oils
10.8.2.6. Adhesives
10.8.2.7. Inks
10.8.3. Cosmetics & Personal Care
10.8.3.1. Creams & Lotions
10.8.3.2. Shampoo & Conditioner
10.8.3.3. Others
10.9. Market Attractiveness Analysis
10.9.1. By Country
10.9.2. By Material Type
10.9.3. By Capacity
10.9.4. By End-Use
10.10. Market Trends
10.11. Key Representative Market Participants
10.12. Key Market Participants – Intensity Mapping
10.13. Drivers and Restraints – Impact Analysis
11. Europe Bag-in-Box Containers Market Analysis and Forecast
11.1. Introduction
11.2. Pricing Analysis
11.3. Key Trends
11.4. Key Regulations
11.5. Market Value (US$ Mn) and Volume (Tons) Historical Analysis 2014-2018 and Forecast 2019-2027, By Country
11.5.1. Germany
11.5.2. Spain
11.5.3. Italy
11.5.4. France
11.5.5. U.K.
11.5.6. BENELUX
11.5.7. Nordics
11.5.8. Russia
11.5.9. Poland
11.5.10. Rest of Europe
11.6. Market Value (US$ Mn) and Volume (Tons) Historical Analysis 2014-2018 and Forecast 2019-2027, By Material Type
11.6.1. Paper/Paperboard
11.6.1.1. Corrugated Cardboard
11.6.1.2. Solid Board
11.6.2. Plastic
11.6.2.1. Low-density polyethylene (LDPE)
11.6.2.2. Ethylene Vinyl Acetate
11.6.2.3. Metallized Polyethylene Terephthalate
11.6.2.4. Ethylene Vinyl Alcohol
11.6.2.5. Nylon
11.6.2.6. Others
11.7. Market Value (US$ Mn) and Volume (Tons) Historical Analysis 2014-2018 and Forecast 2019-2027, By Capacity
11.7.1. Less than 5.0 liters
11.7.2. 5.0 – 10.0 liters
11.7.3. 10.0 - 15.0 liters
11.7.4. 15.0 – 20.0 liters
11.7.5. More than 20.0 liters
11.8. Market Value (US$ Mn) and Volume (Tons) Historical Analysis 2014-2018 and Forecast 2019-2027, By End-Use
11.8.1. Food & Beverages
11.8.1.1. Alcoholic Beverages
11.8.1.1.1. Wine & Spirits
11.8.1.1.2. Beer
11.8.1.1.3. Others
11.8.1.2. Non-Alcoholic Beverages
11.8.1.2.1. Fruit Juices
11.8.1.2.2. Sports & Energy Drinks
11.8.1.2.3. Ice Tea & Coffee
11.8.1.2.4. Others
11.8.1.3. Dairy Products
11.8.1.4. Water
11.8.1.5. Sauces, Vinegar & Flavoring
11.8.1.6. Liquid Egg Products
11.8.1.7. Others
11.8.2. Industrial
11.8.2.1. Chemicals
11.8.2.2. Detergents
11.8.2.3. Floor Cleansers
11.8.2.4. Lubricants
11.8.2.5. Oils
11.8.2.6. Adhesives
11.8.2.7. Inks
11.8.3. Cosmetics & Personal Care
11.8.3.1. Creams & Lotions
11.8.3.2. Shampoo & Conditioner
11.8.3.3. Others
11.9. Market Attractiveness Analysis
11.9.1. By Country
11.9.2. By Material Type
11.9.3. By Capacity
11.9.4. By End-Use
11.10. Market Trends
11.11. Key Representative Market Participants
11.12. Key Market Participants – Intensity Mapping
11.13. Drivers and Restraints – Impact Analysis
12. Asia Pacific (APAC) Bag-in-Box Containers Market Analysis and Forecast
12.1. Introduction
12.2. Pricing Analysis
12.3. Key Trends
12.4. Key Regulations
12.5. Market Value (US$ Mn) and Volume (Tons) Historical Analysis 2014-2018 and Forecast 2019-2027, By Country
12.5.1. China
12.5.2. India
12.5.3. Japan
12.5.4. ASEAN
12.5.5. Australia and New Zealand
12.5.6. Rest of APAC
12.6. Market Value (US$ Mn) and Volume (Tons) Historical Analysis 2014-2018 and Forecast 2019-2027, By Material Type
12.6.1. Paper/Paperboard
12.6.1.1. Corrugated Cardboard
12.6.1.2. Solid Board
12.6.2. Plastic
12.6.2.1. Low-density polyethylene (LDPE)
12.6.2.2. Ethylene Vinyl Acetate
12.6.2.3. Metallized Polyethylene Terephthalate
12.6.2.4. Ethylene Vinyl Alcohol
12.6.2.5. Nylon
12.6.2.6. Others
12.7. Market Value (US$ Mn) and Volume (Tons) Historical Analysis 2014-2018 and Forecast 2019-2027, By Capacity
12.7.1. Less than 5.0 liters
12.7.2. 5.0 – 10.0 liters
12.7.3. 10.0 - 15.0 liters
12.7.4. 15.0 – 20.0 liters
12.7.5. More than 20.0 liters
12.8. Market Value (US$ Mn) and Volume (Tons) Historical Analysis 2014-2018 and Forecast 2019-2027, By End-Use
12.8.1. Food & Beverages
12.8.1.1. Alcoholic Beverages
12.8.1.1.1. Wine & Spirits
12.8.1.1.2. Beer
12.8.1.1.3. Others
12.8.1.2. Non-Alcoholic Beverages
12.8.1.2.1. Fruit Juices
12.8.1.2.2. Sports & Energy Drinks
12.8.1.2.3. Ice Tea & Coffee
12.8.1.2.4. Others
12.8.1.3. Dairy Products
12.8.1.4. Water
12.8.1.5. Sauces, Vinegar & Flavoring
12.8.1.6. Liquid Egg Products
12.8.1.7. Others
12.8.2. Industrial
12.8.2.1. Chemicals
12.8.2.2. Detergents
12.8.2.3. Floor Cleansers
12.8.2.4. Lubricants
12.8.2.5. Oils
12.8.2.6. Adhesives
12.8.2.7. Inks
12.8.3. Cosmetics & Personal Care
12.8.3.1. Creams & Lotions
12.8.3.2. Shampoo & Conditioner
12.8.3.3. Others
12.9. Market Attractiveness Analysis
12.9.1. By Country
12.9.2. By Material Type
12.9.3. By Capacity
12.9.4. By End-Use
12.10. Market Trends
12.11. Key Representative Market Participants
12.12. Key Market Participants – Intensity Mapping
12.13. Drivers and Restraints – Impact Analysis
13. Middle East And Africa (MEA) Bag-in-Box Containers Market Analysis and Forecast
13.1. Introduction
13.2. Pricing Analysis
13.3. Key Trends
13.4. Key Regulations
13.5. Market Value (US$ Mn) and Volume (Tons) Historical Analysis 2014-2018 and Forecast 2019-2027, By Country
13.5.1. GCC countries
13.5.2. Northern Africa
13.5.3. South Africa
13.5.4. Rest of MEA
13.6. Market Value (US$ Mn) and Volume (Tons) Historical Analysis 2014-2018 and Forecast 2019-2027, By Material Type
13.6.1. Paper/Paperboard
13.6.1.1. Corrugated Cardboard
13.6.1.2. Solid Board
13.6.2. Plastic
13.6.2.1. Low-density polyethylene (LDPE)
13.6.2.2. Ethylene Vinyl Acetate
13.6.2.3. Metallized Polyethylene Terephthalate
13.6.2.4. Ethylene Vinyl Alcohol
13.6.2.5. Nylon
13.6.2.6. Others
13.7. Market Value (US$ Mn) and Volume (Tons) Historical Analysis 2014-2018 and Forecast 2019-2027, By Capacity
13.7.1. Less than 5.0 liters
13.7.2. 5.0 – 10.0 liters
13.7.3. 10.0 - 15.0 liters
13.7.4. 15.0 – 20.0 liters
13.7.5. More than 20.0 liters
13.8. Market Value (US$ Mn) and Volume (Tons) Historical Analysis 2014-2018 and Forecast 2019-2027, By End-Use
13.8.1. Food & Beverages
13.8.1.1. Alcoholic Beverages
13.8.1.1.1. Wine & Spirits
13.8.1.1.2. Beer
13.8.1.1.3. Others
13.8.1.2. Non-Alcoholic Beverages
13.8.1.2.1. Fruit Juices
13.8.1.2.2. Sports & Energy Drinks
13.8.1.2.3. Ice Tea & Coffee
13.8.1.2.4. Others
13.8.1.3. Dairy Products
13.8.1.4. Yogurts
13.8.1.5. Water
13.8.1.6. Sauces, Vinegar & Flavoring
13.8.1.7. Liquid Egg Products
13.8.1.8. Others
13.8.2. Industrial
13.8.2.1. Chemicals
13.8.2.2. Detergents
13.8.2.3. Floor Cleansers
13.8.2.4. Lubricants
13.8.2.5. Oils
13.8.2.6. Adhesives
13.8.2.7. Inks
13.8.3. Cosmetics & Personal Care
13.8.3.1. Creams & Lotions
13.8.3.2. Shampoo & Conditioner
13.8.3.3. Others
13.9. Market Attractiveness Analysis
13.9.1. By Country
13.9.2. By Material Type
13.9.3. By Capacity
13.9.4. By End-Use
13.10. Market Trends
13.11. Key Representative Market Participants
13.12. Key Market Participants – Intensity Mapping
13.13. Drivers and Restraints – Impact Analysis
14. Market Structure Analysis
14.1. Market Analysis, by Tier of Companies
14.1.1. By Large, Medium and Small
14.2. Market Concentration
14.2.1. By Top 5 and by Top 10
14.3. Production Capacity Share Analysis
14.3.1. By Large, Medium and Small
14.3.2. By Top 5 and Top 10
14.4. Market Share Analysis of Top 10 Players
14.4.1. The Americas Market Share Analysis, by Top Players
14.4.2. EMEA Market Share Analysis, by Top Players
14.4.3. Asia Pacific Market Share Analysis, by Top Players
14.5. Market Presence Analysis
14.5.1. By Regional footprint of Players
14.5.2. Product footprint by Players
14.5.3. Channel footprint by Players
15. Competition Analysis
15.1. Competition Dashboard
15.2. Competition Benchmarking
15.3. Profitability and Gross Margin Analysis By Competition
15.4. Competition Developments
15.5. Competition Deep Dive (10 Companies)
15.5.1. Smurfit Kappa Group
15.5.1.1. Overview
15.5.1.2. Product Portfolio
15.5.1.3. Profitability
15.5.1.4. Production Footprint
15.5.1.5. Sales Footprint
15.5.1.6. Channel Footprint
15.5.1.7. Competition Benchmarking
15.5.1.8. Strategy
15.5.1.8.1. Marketing Strategy
15.5.1.8.2. Product Strategy
15.5.1.8.3. Channel Strategy
15.5.2. DS Smith Plc.
15.5.2.1. Overview
15.5.2.2. Product Portfolio
15.5.2.3. Profitability
15.5.2.4. Production Footprint
15.5.2.5. Sales Footprint
15.5.2.6. Channel Footprint
15.5.2.7. Competition Benchmarking
15.5.2.8. Strategy
15.5.2.8.1. Marketing Strategy
15.5.2.8.2. Product Strategy
15.5.2.8.3. Channel Strategy
15.5.3. Amcor Limited
15.5.3.1. Overview
15.5.3.2. Product Portfolio
15.5.3.3. Profitability
15.5.3.4. Production Footprint
15.5.3.5. Sales Footprint
15.5.3.6. Channel Footprint
15.5.3.7. Competition Benchmarking
15.5.3.8. Strategy
15.5.3.8.1. Marketing Strategy
15.5.3.8.2. Product Strategy
15.5.3.8.3. Channel Strategy
15.5.4. Liqui-Box
15.5.4.1. Overview
15.5.4.2. Product Portfolio
15.5.4.3. Profitability
15.5.4.4. Production Footprint
15.5.4.5. Sales Footprint
15.5.4.6. Channel Footprint
15.5.4.7. Competition Benchmarking
15.5.4.8. Strategy
15.5.4.8.1. Marketing Strategy
15.5.4.8.2. Product Strategy
15.5.4.8.3. Channel Strategy
15.5.5. Scholle IPN
15.5.5.1. Overview
15.5.5.2. Product Portfolio
15.5.5.3. Profitability
15.5.5.4. Production Footprint
15.5.5.5. Sales Footprint
15.5.5.6. Channel Footprint
15.5.5.7. Competition Benchmarking
15.5.5.8. Strategy
15.5.5.8.1. Marketing Strategy
15.5.5.8.2. Product Strategy
15.5.5.8.3. Channel Strategy
15.5.6. CDF Corporation
15.5.6.1. Overview
15.5.6.2. Product Portfolio
15.5.6.3. Profitability
15.5.6.4. Production Footprint
15.5.6.5. Sales Footprint
15.5.6.6. Channel Footprint
15.5.6.7. Competition Benchmarking
15.5.6.8. Strategy
15.5.6.8.1. Marketing Strategy
15.5.6.8.2. Product Strategy
15.5.6.8.3. Channel Strategy
15.5.7. Vine Valley Ventures LLC
15.5.7.1. Overview
15.5.7.2. Product Portfolio
15.5.7.3. Profitability
15.5.7.4. Production Footprint
15.5.7.5. Sales Footprint
15.5.7.6. Channel Footprint
15.5.7.7. Competition Benchmarking
15.5.7.8. Strategy
15.5.7.8.1. Marketing Strategy
15.5.7.8.2. Product Strategy
15.5.7.8.3. Channel Strategy
15.5.8. Parish Manufacturing Inc.
15.5.8.1. Overview
15.5.8.2. Product Portfolio
15.5.8.3. Profitability
15.5.8.4. Production Footprint
15.5.8.5. Sales Footprint
15.5.8.6. Channel Footprint
15.5.8.7. Competition Benchmarking
15.5.8.8. Strategy
15.5.8.8.1. Marketing Strategy
15.5.8.8.2. Product Strategy
15.5.8.8.3. Channel Strategy
15.5.9. TPS Rental Systems Ltd
15.5.9.1. Overview
15.5.9.2. Product Portfolio
15.5.9.3. Profitability
15.5.9.4. Production Footprint
15.5.9.5. Sales Footprint
15.5.9.6. Channel Footprint
15.5.9.7. Competition Benchmarking
15.5.9.8. Strategy
15.5.9.8.1. Marketing Strategy
15.5.9.8.2. Product Strategy
15.5.9.8.3. Channel Strategy
15.5.10. Optopack Ltd.
15.5.10.1. Overview
15.5.10.2. Product Portfolio
15.5.10.3. Profitability
15.5.10.4. Production Footprint
15.5.10.5. Sales Footprint
15.5.10.6. Channel Footprint
15.5.10.7. Competition Benchmarking
15.5.10.8. Strategy
15.5.10.8.1. Marketing Strategy
15.5.10.8.2. Product Strategy
15.5.10.8.3. Channel Strategy
16. Assumptions and Acronyms Used
17. Research Methodology
List of Tables
Table 01: Global Bag-in-Box Containers Market Value (US$ Mn) & Volume (Tonnes) 2014-2027, by Capacity
Table 02: Global Bag-in-Box Containers Market Value (US$ Mn) & Volume (Tonnes) 2014-2027, by Material Type
Table 03: Global Bag-in-Box Containers Market Value (US$ Mn) & Volume (Tonnes) 2014-2027, by End Use
Table 04: Global Bag-in-Box Containers Market Value (US$ Mn) & Volume (Tonnes) 2014-2027, by End Use
Table 05: Global Bag-in-Box Containers Market Value (US$ Mn) & Volume (Tonnes) 2014-2027, by End Use
Table 06: Global Bag-in-Box Containers Market Value (US$ Mn) & Volume (Tonnes) 2014-2027, by End Use
Table 07: Global Bag-in-Box Containers Market Value (US$ Mn) & Volume (Tonnes) 2014-2027, by Region
Table 08: North America Bag-in-Box Containers Market Value (US$ Mn) & Volume (Tonnes) 2014-2027, by Country
Table 09: North America Bag-in-Box Containers Market Value (US$ Mn) & Volume (Tonnes) 2014-2027, by Capacity
Table 10: North America Bag-in-Box Containers Market Value (US$ Mn) & Volume (Tonnes) 2014-2027, by Material Type
Table 11: North America Bag-in-Box Containers Market Value (US$ Mn) & Volume (Tonnes) 2014-2027, by End Use
Table 12: North America Bag-in-Box Containers Market Value (US$ Mn) & Volume (Tonnes) 2014-2027, by End Use
Table 13: North America Bag-in-Box Containers Market Value (US$ Mn) & Volume (Tonnes) 2014-2027, by End Use
Table 14: North America Bag-in-Box Containers Market Value (US$ Mn) & Volume (Tonnes) 2014-2027, by End Use
Table 15: Latin America Bag-in-Box Containers Market Value (US$ Mn) & Volume (Tonnes) 2014-2027, by Country
Table 16: Latin America Bag-in-Box Containers Market Value (US$ Mn) & Volume (Tonnes) 2014-2027, by Capacity
Table 17: Latin America Bag-in-Box Containers Market Value (US$ Mn) & Volume (Tonnes) 2014-2027, by Material Type
Table 18: Latin America Bag-in-Box Containers Market Value (US$ Mn) & Volume (Tonnes) 2014-2027, by End Use
Table 19: Latin America Bag-in-Box Containers Market Value (US$ Mn) & Volume (Tonnes) 2014-2027, by End Use
Table 20: Latin America Bag-in-Box Containers Market Value (US$ Mn) & Volume (Tonnes) 2014-2027, by End Use
Table 21: Latin America Bag-in-Box Containers Market Value (US$ Mn) & Volume (Tonnes) 2014-2027, by End Use
Table 22: Europe Bag-in-Box Containers Market Value (US$ Mn) & Volume (Tonnes) 2014-2027, by Country
Table 23: Europe Bag-in-Box Containers Market Value (US$ Mn) & Volume (Tonnes) 2014-2027, by Capacity
Table 24: Europe Bag-in-Box Containers Market Value (US$ Mn) & Volume (Tonnes) 2014-2027, by Material Type
Table 25: Europe Bag-in-Box Containers Market Value (US$ Mn) & Volume (Tonnes) 2014-2027, by End Use
Table 26: Europe Bag-in-Box Containers Market Value (US$ Mn) & Volume (Tonnes) 2014-2027, by End Use
Table 27: Europe Bag-in-Box Containers Market Value (US$ Mn) & Volume (Tonnes) 2014-2027, by End Use
Table 28: Europe Bag-in-Box Containers Market Value (US$ Mn) & Volume (Tonnes) 2014-2027, by End Use
Table 29: APAC Bag-in-Box Containers Market Value (US$ Mn) & Volume (Tonnes) 2014-2027, by Country
Table 30: APAC Bag-in-Box Containers Market Value (US$ Mn) & Volume (Tonnes) 2014-2027, by Capacity
Table 31: APAC Bag-in-Box Containers Market Value (US$ Mn) & Volume (Tonnes) 2014-2027, by Material Type
Table 32: APAC Bag-in-Box Containers Market Value (US$ Mn) & Volume (Tonnes) 2014-2027, by End Use
Table 33: APAC Bag-in-Box Containers Market Value (US$ Mn) & Volume (Tonnes) 2014-2027, by End Use
Table 34: APAC Bag-in-Box Containers Market Value (US$ Mn) & Volume (Tonnes) 2014-2027, by End Use
Table 35: APAC Bag-in-Box Containers Market Value (US$ Mn) & Volume (Tonnes) 2014-2027, by End Use
Table 36: MEA Bag-in-Box Containers Market Value (US$ Mn) & Volume (Tonnes) 2014-2027, by Country
Table 37: MEA Bag-in-Box Containers Market Value (US$ Mn) & Volume (Tonnes) 2014-2027, by Capacity
Table 38: MEA Bag-in-Box Containers Market Value (US$ Mn) & Volume (Tonnes) 2014-2027, by Material Type
Table 39: MEA Bag-in-Box Containers Market Value (US$ Mn) & Volume (Tonnes) 2014-2027, by End Use
Table 40: MEA Bag-in-Box Containers Market Value (US$ Mn) & Volume (Tonnes) 2014-2027, by End Use
Table 41: MEA Bag-in-Box Containers Market Value (US$ Mn) & Volume (Tonnes) 2014-2027, by End Use
Table 42: MEA Bag-in-Box Containers Market Value (US$ Mn) & Volume (Tonnes) 2014-2027, by End Use
List of Figures
Figure 01: Global Bag-in-Box Containers Market BPS Analysis, by Capacity Type, 2014(A), 2019(E) & 2027(F)
Figure 02: Global Bag-in-Box Containers Market Y-o-Y growth, by Capacity Type, 2015(A) – 2027(F)
Figure 03: Global Bag-in-Box Containers Market BPS Analysis, by Capacity Type, 2014(A), 2019(E) & 2027(F)
Figure 04: Global Bag-in-Box Containers Market BPS Analysis, by Material Type, 2014(A), 2019(E) & 2027(F)
Figure 05: Global Bag-in-Box Containers Market Y-o-Y growth, by Material Type, 2015(A) – 2027(F)
Figure 06: Global Bag-in-Box Containers Market Attractiveness Index, by Material Type, 2019(E) – 2027(F)
Figure 07: Global Bag-in-Box Containers Market BPS Analysis, by End Use, 2014(A), 2019(E) & 2027(F)
Figure 08: Global Bag-in-Box Containers Market Y-o-Y growth, by End Use, 2015(A) – 2027(F)
Figure 09: Global Bag-in-Box Containers Market Attractiveness Index, by End Use, 2019(E) – 2027(F)
Figure 10: Global Bag-in-Box Containers Market BPS Analysis, by Region, 2014(A), 2019(E) & 2027(F)
Figure 11: Global Bag-in-Box Containers Market Y-o-Y growth, by Region, 2015(A) – 2027(F)
Figure 12: Global Bag-in-Box Containers Market Attractiveness Index, by Region, 2019(E) – 2027(F)
Figure 13: North America Bag-in-Box Containers Market Value share 2019(E) by Capacity
Figure 14: North America Bag-in-Box Containers Market Value share 2019(E) by Material
Figure 15: North America Bag-in-Box Containers Market Value share 2019(E) by End Use
Figure 16: North America Bag-in-Box Containers Market BPS Analysis, by Country, 2014(A), 2019(E) & 2027(F)
Figure 17: North America Bag-in-Box Containers Market Y-o-Y growth, by Country, 2019(E) – 2027(F)
Figure 18: North America Bag-in-Box Containers Market BPS Analysis, by Capacity, 2014(A), 2019(E) & 2027(F)
Figure 19: North America Bag-in-Box Containers Market BPS Analysis, by Capacity Type, 2014(A), 2019(E) & 2027(F)
Figure 20: North America Bag-in-Box Containers Market BPS Analysis, by Material, 2014(A), 2019(E) & 2027(F)
Figure 21: North America Bag-in-Box Containers Market Attractiveness Index, by Material Type, 2019(E) – 2027(F)
Figure 22: North America Bag-in-Box Containers Market BPS Analysis, by End Use, 2014(A), 2019(E) & 2027(F)
Figure 23: North America Bag-in-Box Containers Market Attractiveness Index, by End Use, 2019(E) – 2027(F)
Figure 24: Latin America Bag-in-Box Containers Market Value share 2019(E) by Capacity
Figure 25: Latin America Bag-in-Box Containers Market Value share 2019(E) by Material
Figure 26: Latin America Bag-in-Box Containers Market Value share 2019(E) by End Use
Figure 27: Latin America Bag-in-Box Containers Market BPS Analysis, by Country, 2014(A), 2019(E) & 2027(F)
Figure 28: Latin America Bag-in-Box Containers Market Y-o-Y growth, by Country, 2019(E) – 2027(F)
Figure 29: Latin America Bag-in-Box Containers Market BPS Analysis, by Capacity, 2014(A), 2019(E) & 2027(F)
Figure 30: Latin America Bag-in-Box Containers Market BPS Analysis, by Capacity Type, 2014(A), 2019(E) & 2027(F)
Figure 31: Latin America Bag-in-Box Containers Market BPS Analysis, by Material, 2014(A), 2019(E) & 2027(F)
Figure 32: Latin America Bag-in-Box Containers Market Attractiveness Index, by Material Type, 2019(E) – 2027(F)
Figure 33: Latin America Bag-in-Box Containers Market BPS Analysis, by End Use, 2014(A), 2019(E) & 2027(F)
Figure 34: Latin America Bag-in-Box Containers Market Attractiveness Index, by End Use, 2019(E) – 2027(F)
Figure 35: Europe Bag-in-Box Containers Market Value share 2019(E) by Capacity
Figure 36: Europe Bag-in-Box Containers Market Value share 2019(E) by Material
Figure 37: Europe Bag-in-Box Containers Market Value share 2019(E) by End Use
Figure 38: Europe Bag-in-Box Containers Market BPS Analysis, by Country, 2014(A), 2019(E) & 2027(F)
Figure 39: Europe Bag-in-Box Containers Market Y-o-Y growth, by Country, 2019(E) – 2027(F)
Figure 40: Europe Bag-in-Box Containers Market BPS Analysis, by Capacity, 2014(A), 2019(E) & 2027(F)
Figure 41: Europe Bag-in-Box Containers Market BPS Analysis, by Capacity, 2014(A), 2019(E) & 2027(F)
Figure 42: Europe Bag-in-Box Containers Market BPS Analysis, by Material, 2014(A), 2019(E) & 2027(F)
Figure 43: Europe Bag-in-Box Containers Market Attractiveness Index, by Material Type, 2019(E) – 2027(F)
Figure 44: Europe Bag-in-Box Containers Market BPS Analysis, by End Use, 2014(A), 2019(E) & 2027(F)
Figure 45: Europe Bag-in-Box Containers Market Attractiveness Index, by End Use, 2019(E) – 2027(F)
Figure 46: APAC Bag-in-Box Containers Market Value share 2019(E) by Capacity
Figure 47: APAC Bag-in-Box Containers Market Value share 2019(E) by Material
Figure 48: APAC Bag-in-Box Containers Market Value share 2019(E) by End Use
Figure 49: APAC Bag-in-Box Containers Market BPS Analysis, by Country, 2014(A), 2019(E) & 2027(F)
Figure 50: APAC Bag-in-Box Containers Market Y-o-Y growth, by Country, 2019(E) – 2027(F)
Figure 51: APAC Bag-in-Box Containers Market BPS Analysis, by Capacity, 2014(A), 2019(E) & 2027(F)
Figure 52: APAC Bag-in-Box Containers Market BPS Analysis, by Capacity, 2014(A), 2019(E) & 2027(F)
Figure 53: APAC Bag-in-Box Containers Market BPS Analysis, by Material, 2014(A), 2019(E) & 2027(F)
Figure 54: APAC Bag-in-Box Containers Market Attractiveness Index, by Material Type, 2019(E) – 2027(F)
Figure 55: APAC Bag-in-Box Containers Market BPS Analysis, by End Use, 2014(A), 2019(E) & 2027(F)
Figure 56: APAC Bag-in-Box Containers Market Attractiveness Index, by End Use, 2019(E) – 2027(F)
Figure 57: MEA Bag-in-Box Containers Market Value share 2019(E) by Capacity
Figure 58: MEA Bag-in-Box Containers Market Value share 2019(E) by Material
Figure 59: MEA Bag-in-Box Containers Market Value share 2019(E) by End Use
Figure 60: MEA Bag-in-Box Containers Market BPS Analysis, by Country, 2014(A), 2019(E) & 2027(F)
Figure 61: MEA Bag-in-Box Containers Market Y-o-Y growth, by Country, 2019(E) – 2027(F)
Figure 62: MEA Bag-in-Box Containers Market BPS Analysis, by Capacity, 2014(A), 2019(E) & 2027(F)
Figure 63: MEA Bag-in-Box Containers Market BPS Analysis, by Capacity, 2014(A), 2019(E) & 2027(F)
Figure 64: MEA Bag-in-Box Containers Market BPS Analysis, by Material, 2014(A), 2019(E) & 2027(F)
Figure 65: MEA Bag-in-Box Containers Market Attractiveness Index, by Material Type, 2019(E) – 2027(F)
Figure 66: MEA Bag-in-Box Containers Market BPS Analysis, by End Use, 2014(A), 2019(E) & 2027(F)
Figure 67: MEA Bag-in-Box Containers Market Attractiveness Index, by End Use, 2019(E) – 2027(F)
Copyright © Transparency Market Research, Inc. All Rights reserved
Trust Online

Bag-in-Box Containers Market
