Analysts’ Viewpoint on Automotive Suspension Parts Market Scenario
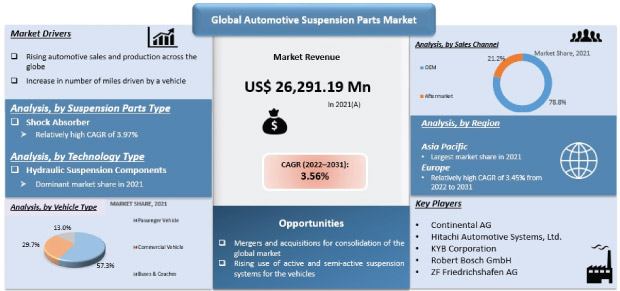
Companies operating in the automotive suspension parts market are focusing on offering safety and comfort solutions for customers & to develop high-performance vehicles. They are also emphasizing on the development of advanced technology suspension parts for vehicles. These advanced solutions include active and semi-active suspension systems, while the active suspension system uses different types of actuators to lower and raise the vehicle chassis independently at each wheel. On the other hand, manufacturers vary the firmness of the shock absorbers in order to match changing road conditions for the semi-active suspension systems. To overcome the economic slowdown caused by the COVID-19 pandemic, companies are increasing import and export trade to pump revenue into the value chain.
Automotive suspension parts are ideally utilized to keep a vehicle stable on the road and to reduce vehicle body roll over sharp corners, curves, or large bumps. Moreover, suspension components also help maintain the independent movement of each vehicle tire. A car suspension system includes several parts such as shock observers, struts, links, coil, leaf, and torsion bar. All such components are designed by automotive suspension manufacturers to decrease the force from opposing sides of a vehicle and to raise or lower the vehicle in order to maintain a stable position.
Automotive suspension market growth factors can be attributed to the introduction of different technological innovations. Increasing integration of sensors and electronics in the suspension component has led to the development of various advanced suspension systems. For instance, continuous damping control (CDC) is one of the prime features in advanced suspension systems, which are equipped with shock absorbers that utilize one or two electrically controlled solenoid valves. This can optimize damping and further improve the ride quality of the vehicle.
The active suspension system has the capability to continuously adjust itself for different road conditions, while such a system artificially extends itself and constantly monitors & adjusts as per the changing road & vehicle situations. Moreover, advanced sensors and microprocessors in the active suspension system provide frequent information in real-time, due to which it can respond to erratic road conditions & further offers superior road feel, safety, responsiveness & vehicle handling.
Manufacturers of premium and luxury cars are also integrating active & semi-active suspensions in order to replace conventional suspension parts. These next-gen automotive suspension parts are offering significant opportunities for expansion of the market. Several auto component manufacturers are making heavy investments to produce highly advanced and efficient car suspensions, which further propel the growth of the automotive suspension parts market. OEMs are increasing output capacities in different types of suspension system.
The automotive industry across the globe has been witnessing significant expansion over the past two decades. The automotive industry in North America and Europe is highly mature, while the same industry in most of the developing countries including India and South Korea, has made rapid advancements in terms of vehicle production. China recorded the highest production of passenger vehicles across the globe, which was around 21 million units for the year 2021. Therefore, a rise in vehicle production volume in developed and developing nations is propelling the demand for suspension components.
The automotive suspension parts market for premium and luxury vehicles in North America & Europe is considered to be dynamic, due to the large domestic consumer base along with high manufacturing costs and safety concerns. Such findings make these regions highly lucrative for the adoption of different suspension systems that further improve vehicle performance. Moreover, an increase in upper-class population and consumer spending in North America & Europe, who tends to purchase high-end passenger & light commercial vehicles, are compelling automotive companies to boost their output capacities. This, in turn, is estimated to drive the automotive industry and subsequently, bolster the demand for automotive suspension parts.
Rising investment by governments for the development of infrastructure and easy availability of loans or finance solutions for vehicle purchase is also expected to propel vehicle sales and further boost the expansion of the automotive suspension parts market.
Increasing stringency of vehicle safety and regulations in developed & developing countries are considered key factors that are boosting the integration of shock absorbers and other suspension components in vehicles. These advancements are in turn steering growth in the automotive suspension parts market.
In terms of suspension parts type, the global automotive suspension parts market has been split into shock absorbers, struts, links, and springs. The shock absorbers segment held a dominant share of 38.3% of the automotive suspension parts market in 2021. It is estimated to maintain its dominant position and advance at a growth rate of more than 3% during the forecast period. This can be attributed to innovations in shock absorbers which include the replacement of hydraulic dampers with electromechanical rotary dampers to enable an even more comfortable ride.
Shock absorbers are primarily utilized to control spring and suspension movement. Hence, they play an important role in the performance of the vehicle’s suspension system. Moreover, the rising usage of commercial vehicles for off-road projects is expected to boost the demand for shock absorbers. Furthermore, automotive suspension springs, struts, and links are also gaining popularity in most passenger & commercial vehicles in order to ensure a smooth & high-performance driving experience. Additionally, demand for active and semi-active suspension systems is increasing due to the rising preference for premium & luxury cars, which further drives the shock absorber segment. This can be attributed to an upgrade in the disposable income of car buyers in both developed and developing economies. However, car manufacturers should adopt predictive analysis software platforms to streamline budgets since financial experts are predicting an economic recession in the 3rd or 4th quarter of 2022.
Based on technology type, the global automotive suspension parts market has been bifurcated into gas charged suspension components and hydraulic suspension components. The hydraulic suspension components segment held a significant share of the global automotive suspension parts market and accounted for 57.5% share in 2021. However, it has been found that the hydraulic suspension components segment is projected to grow at a sluggish CAGR of 3.17% during the forecast period. This is evident since new technologies like electromechanical rotary dampers in shock absorbers and innovations in air suspension systems are emerging as a substitute for hydraulic suspension technology. Hence, automotive suspension parts suppliers should diversify their focus on air suspension systems and create awareness about the advantages of hydraulic suspension such as the flexibility of customization to meet specific requirements & desired level of performance in automobiles.
Hydraulic suspension technology is a well-known technology and is extensively adopted among most entry & mid-range vehicles. Such trends are contributing toward market expansion. On the other hand, demand for gas charged suspension components has increased at a rapid pace, as they are increasingly being integrated into premium & luxury vehicles. The primary focus of vehicle manufacturers these days is to enhance the performance of their vehicle models to gain a competitive edge over other automotive giants. This is expected to boost revenue growth in the gas charged suspension components segment throughout the assessment tenure.
The automotive suspension market size & share can be elaborated on a regional basis. In terms of revenue, Asia Pacific accounted for a notable share of 40.3% of the global automotive suspension parts market in 2021. The rise in production and sales of the passenger as well as commercial vehicles has resulted in significant demand for automotive suspension components. Moreover, demand for suspension components in the passenger cars segment accounted for around 67% share of the automotive suspension parts market in the Asia Pacific. This is evident since robust hydraulic suspension systems in vehicles are facilitating fast reaction time, implying that the suspension’s response on rough roads is instantaneous. Additionally, China accounts for almost 50% of the automotive suspension parts market in the Asia Pacific. The high presence of automotive heavyweights and government support for the strengthening of China’s automotive industry are leading factors that make China a lucrative market for investments & implementation of inorganic business strategies.
North America and Europe are also large-scale consumers of automotive suspension parts, and the regions held a cumulative share of 56% of the global market in 2021. The proliferation of premium light commercial vehicles and electric & hybrid electric vehicles across North America & Europe is also driving the demand for automotive suspension systems in these regions.
Middle East & Africa also have a large consumer base for luxury and sports cars, where manufacturers are integrating active & semi-active suspension systems in vehicles. This is estimated to boost growth in the market in these regions at a prominent growth rate during the forecast period. Companies are increasing R&D in top steering and suspension technology to gain a competitive advantage over other market players.
|
Attribute |
Detail |
|
Market Size Value in 2021 |
US$ 26.2 Bn |
|
Market Forecast Value in 2031 |
US$ 37.1 Bn |
|
Growth Rate (CAGR) |
3.56% |
|
Forecast Period |
2022–2031 |
|
Historical Data Available for |
2017–2020 |
|
Quantitative Units |
US$ Mn for Value and Million Units for Volume |
|
Market Analysis |
It includes cross segment analysis at global as well as regional level. Furthermore, qualitative analysis includes drivers, restraints, opportunities, key trends, Porter’s Five Forces analysis, value chain analysis, and key trend analysis. |
|
Competition Landscape |
|
|
Format |
Electronic (PDF) + Excel |
|
Market Segmentation |
|
|
Regions Covered |
|
|
Countries Covered |
|
|
Companies Profiled |
|
|
Customization Scope |
Available upon request |
|
Pricing |
Available upon request |
The automotive suspension parts market is expected to cross the value of US$ 37.1 Bn by 2031.
The automotive suspension parts market is estimated to expand at a CAGR of 3.56% during the forecast period.
Rise in automotive production & sales and increase in concerns among customers about performance and safety of vehicles are key factors driving the automotive suspension parts market.
The passenger vehicle segment accounted for a prominent share of 57% of the automotive suspension parts market in 2021.
Asia Pacific is more attractive for vendors in the automotive suspension parts market.
Key players of the automotive suspension parts market include Brinn Inc., BWI Group, Continental AG, Datsons Engineering Works Pvt. Ltd., DMA Sales, Inc., Duroshox, Endurance Technologies Limited, FCS Auto, Halla Holdings Corp., Hitachi Automotive Systems, Ltd., Kalyani Forge, Kobe Suspensions, KYB Corporation, LEACREE Company, Magneti Marelli S.p.A., Mubea Suspension Pvt. Ltd., QBAutomotive Inc., Ride Control, LLC, Robert Bosch GmbH, Samavardhana Motherson Group, Tenneco Inc., and ZF Friedrichs
1. Executive Summary
1.1. Market Outlook
1.1.1. Market Value US$ Mn, 2017‒2031
1.2. Competitive Dashboard Analysis
2. Market Overview
2.1. TMR Analysis and Recommendations
2.2. Market Coverage / Taxonomy
2.3. Market Definition / Scope / Limitations
2.4. Macro-Economic Factors
2.5. Market Dynamics
2.5.1. Drivers
2.5.2. Restraints
2.5.3. Opportunity
2.6. Market Factor Analysis
2.6.1. Porter’s Five Force Analysis
2.6.2. SWOT Analysis
2.7. Regulatory Scenario
2.8. Key Trend Analysis
2.9. Value Chain Analysis
2.10. Gross Margin Analysis
3. Pricing Analysis
4. COVID-19 Impact Analysis – Automotive Suspension Parts
5. Material Analysis by Key Players for each country
6. Global Automotive Suspension Parts Market
6.1. Market Snapshot
6.2. Global Automotive Suspension Parts Market Size Analysis & Forecast, by Technology Type, 2017‒2031
6.2.1. Gas charged suspension components
6.2.2. Hydraulic suspension components
6.3. Automotive Suspension Parts Market Size Analysis & Forecast, by Suspension Parts Type, 2017‒2031
6.3.1. Shock Absorbers
6.3.1.1. Conventional
6.3.1.2. Regenerative
6.3.2. Struts
6.3.3. Links
6.3.3.1. Straight Bars
6.3.3.2. Forged
6.3.3.3. Cast
6.3.3.4. Stamped
6.3.4. Springs
6.3.4.1. Coil
6.3.4.2. Leaf
6.3.4.3. Torsion
6.4. Automotive Suspension Parts Market Size Analysis & Forecast, by Vehicle Type, 2017‒2031
6.4.1. Passenger Vehicles
6.4.1.1. Entry
6.4.1.2. Mid
6.4.1.3. Premium/ Luxury
6.4.2. Commercial Vehicle
6.4.2.1. Light Commercial Vehicles
6.4.2.2. Medium and Heavy Duty Trucks
6.4.2.3. Buses and Coaches
6.5. Automotive Suspension Parts Market Size Analysis & Forecast, by Sales Channel, 2017‒2031
6.5.1. OEM
6.5.2. Aftermarket
6.6. Key Region Analysis – Global Automotive Suspension Parts Market Size Analysis & Forecast, 2017‒2031
6.6.1. Americas
6.6.2. Europe
6.6.3. Asia Pacific
6.6.4. Middle East & Africa
7. Americas Automotive Suspension Parts Market
7.1. Market Snapshot
7.2. Americas Automotive Suspension Parts Market Size Analysis & Forecast, by Technology Type, 2017‒2031
7.2.1. Gas charged suspension components
7.2.2. Hydraulic suspension components
7.3. Automotive Suspension Parts Market Size Analysis & Forecast, by Suspension Parts Type, 2017‒2031
7.3.1. Shock Absorbers
7.3.1.1. Conventional
7.3.1.2. Regenerative
7.3.2. Struts
7.3.3. Links
7.3.3.1. Straight Bars
7.3.3.2. Forged
7.3.3.3. Cast
7.3.3.4. Stamped
7.3.4. Springs
7.3.4.1. Coil
7.3.4.2. Leaf
7.3.4.3. Torsion
7.4. Automotive Suspension Parts Market Size Analysis & Forecast, by Vehicle Type, 2017‒2031
7.4.1. Passenger Vehicles
7.4.1.1. Entry
7.4.1.2. Mid
7.4.1.3. Premium/ Luxury
7.4.2. Commercial Vehicle
7.4.2.1. Light Commercial Vehicles
7.4.2.2. Medium and Heavy Duty Trucks
7.4.2.3. Buses and Coaches
7.5. Automotive Suspension Parts Market Size Analysis & Forecast, by Sales Channel, 2017‒2031
7.5.1. OEM
7.5.2. Aftermarket
7.6. Key Country Analysis – Americas Automotive Suspension Parts Market Size Analysis & Forecast, 2017‒2031
7.6.1. U. S.
7.6.2. Canada
7.6.3. Mexico
7.6.4. Brazil
7.6.5. Argentina
7.6.6. Colombia
7.6.7. Rest of Americas
8. Europe Automotive Suspension Parts Market
8.1. Market Snapshot
8.2. Europe Automotive Suspension Parts Market Size Analysis & Forecast, by Technology Type, 2017‒2031
8.2.1. Gas charged suspension components
8.2.2. Hydraulic suspension components
8.3. Automotive Suspension Parts Market Size Analysis & Forecast, by Suspension Parts Type, 2017‒2031
8.3.1. Shock Absorbers
8.3.1.1. Conventional
8.3.1.2. Regenerative
8.3.2. Struts
8.3.3. Links
8.3.3.1. Straight Bars
8.3.3.2. Forged
8.3.3.3. Cast
8.3.3.4. Stamped
8.3.4. Springs
8.3.4.1. Coil
8.3.4.2. Leaf
8.3.4.3. Torsion
8.4. Automotive Suspension Parts Market Size Analysis & Forecast, by Vehicle Type, 2017‒2031
8.4.1. Passenger Vehicles
8.4.1.1. Entry
8.4.1.2. Mid
8.4.1.3. Premium/ Luxury
8.4.2. Commercial Vehicle
8.4.2.1. Light Commercial Vehicles
8.4.2.2. Medium and Heavy Duty Trucks
8.4.2.3. Buses and Coaches
8.5. Automotive Suspension Parts Market Size Analysis & Forecast, by Sale Channel, 2017‒2031
8.5.1. OEM
8.5.2. Aftermarket
8.6. Key Country Analysis – Europe Automotive Suspension Parts Market Size Analysis & Forecast, 2017‒2031
8.6.1. Germany
8.6.2. U. K.
8.6.3. France
8.6.4. Italy
8.6.5. Spain
8.6.6. Czech Republic
8.6.7. Slovakia
8.6.8. Poland
8.6.9. Romania
8.6.10. Hungary
8.6.11. Belgium
8.6.12. Nordic Countries
8.6.13. Russia & CIS
8.6.14. Rest of Europe
9. Asia Pacific Automotive Suspension Parts Market
9.1. Market Snapshot
9.2. Asia Pacific Automotive Suspension Parts Market Size Analysis & Forecast, by Technology Type, 2017‒2031
9.2.1. Gas charged suspension components
9.2.2. Hydraulic suspension components
9.3. Automotive Suspension Parts Market Size Analysis & Forecast, by Suspension Parts Type, 2017‒2031
9.3.1. Shock Absorbers
9.3.1.1. Conventional
9.3.1.2. Regenerative
9.3.2. Struts
9.3.3. Links
9.3.3.1. Straight Bars
9.3.3.2. Forged
9.3.3.3. Cast
9.3.3.4. Stamped
9.3.4. Springs
9.3.4.1. Coil
9.3.4.2. Leaf
9.3.4.3. Torsion
9.4. Automotive Suspension Parts Market Size Analysis & Forecast, by Vehicle Type, 2017‒2031
9.4.1. Passenger Vehicles
9.4.1.1. Entry
9.4.1.2. Mid
9.4.1.3. Premium/ Luxury
9.4.2. Commercial Vehicle
9.4.2.1. Light Commercial Vehicles
9.4.2.2. Medium and Heavy Duty Trucks
9.4.2.3. Buses and Coaches
9.5. Automotive Suspension Parts Market Size Analysis & Forecast, by Sales Channel, 2017‒2031
9.5.1. OEM
9.5.2. Aftermarket
9.6. Key Country Analysis – Asia Pacific Automotive Suspension Parts Market Size Analysis & Forecast, 2017‒2031
9.6.1. China
9.6.2. India
9.6.3. Japan
9.6.4. South Korea
9.6.5. ANZ
9.6.6. ASEAN Countries
9.6.7. Rest of Asia Pacific
10. Middle East & Africa Automotive Suspension Parts Market
10.1. Market Snapshot
10.2. Middle East & Africa Automotive Suspension Parts Market Size Analysis & Forecast, by Technology Type, 2017‒2031
10.2.1. Gas charged suspension components
10.2.2. Hydraulic suspension components
10.3. Automotive Suspension Parts Market Size Analysis & Forecast, by Suspension Parts Type, 2017‒2031
10.3.1. Shock Absorbers
10.3.1.1. Conventional
10.3.1.2. Regenerative
10.3.2. Struts
10.3.3. Links
10.3.3.1. Straight Bars
10.3.3.2. Forged
10.3.3.3. Cast
10.3.3.4. Stamped
10.3.4. Springs
10.3.4.1. Coil
10.3.4.2. Leaf
10.3.4.3. Torsion
10.4. Automotive Suspension Parts Market Size Analysis & Forecast, by Vehicle Type, 2017‒2031
10.4.1. Passenger Vehicles
10.4.1.1. Entry
10.4.1.2. Mid
10.4.1.3. Premium/ Luxury
10.4.2. Commercial Vehicle
10.4.2.1. Light Commercial Vehicles
10.4.2.2. Medium and Heavy Duty Trucks
10.4.2.3. Buses and Coaches
10.5. Automotive Suspension Parts Market Size Analysis & Forecast, by Sale Channel, 2017‒2031
10.5.1. OEM
10.5.2. Aftermarket
10.6. Key Country Analysis – Middle East & Africa Automotive Suspension Parts Market Size Analysis & Forecast, 2017‒2031
10.6.1. GCC Countries
10.6.2. Turkey
10.6.3. South Africa
10.6.4. Rest of Middle East & Africa
11. Competitive Landscape
11.1. Company Share Analysis/ Brand Share Analysis, 2021
11.2. Pricing comparison among key players
11.3. Company Analysis for each player (Company Overview, Company Footprints, Production Locations, Product Portfolio, Competitors & Customers, Subsidiaries & Parent Organization, Recent Developments, Financial Analysis, Profitability, Revenue Share)
11.4. Company Profile/ Key Players
11.4.1. Brinn Inc.
11.4.1.1. Company Overview
11.4.1.2. Company Footprints
11.4.1.3. Production Locations
11.4.1.4. Product Portfolio
11.4.1.5. Competitors & Customers
11.4.1.6. Subsidiaries & Parent Organization
11.4.1.7. Recent Developments
11.4.1.8. Financial Analysis
11.4.1.9. Profitability
11.4.1.10. Revenue Share
11.4.2. BWI Group
11.4.2.1. Company Overview
11.4.2.2. Company Footprints
11.4.2.3. Production Locations
11.4.2.4. Product Portfolio
11.4.2.5. Competitors & Customers
11.4.2.6. Subsidiaries & Parent Organization
11.4.2.7. Recent Developments
11.4.2.8. Financial Analysis
11.4.2.9. Profitability
11.4.2.10. Revenue Share
11.4.3. Continental AG
11.4.3.1. Company Overview
11.4.3.2. Company Footprints
11.4.3.3. Production Locations
11.4.3.4. Product Portfolio
11.4.3.5. Competitors & Customers
11.4.3.6. Subsidiaries & Parent Organization
11.4.3.7. Recent Developments
11.4.3.8. Financial Analysis
11.4.3.9. Profitability
11.4.3.10. Revenue Share
11.4.4. Datsons Engineering Works Pvt. Ltd.
11.4.4.1. Company Overview
11.4.4.2. Company Footprints
11.4.4.3. Production Locations
11.4.4.4. Product Portfolio
11.4.4.5. Competitors & Customers
11.4.4.6. Subsidiaries & Parent Organization
11.4.4.7. Recent Developments
11.4.4.8. Financial Analysis
11.4.4.9. Profitability
11.4.4.10. Revenue Share
11.4.5. DMA Sales, Inc.
11.4.5.1. Company Overview
11.4.5.2. Company Footprints
11.4.5.3. Production Locations
11.4.5.4. Product Portfolio
11.4.5.5. Competitors & Customers
11.4.5.6. Subsidiaries & Parent Organization
11.4.5.7. Recent Developments
11.4.5.8. Financial Analysis
11.4.5.9. Profitability
11.4.5.10. Revenue Share
11.4.6. Duroshox
11.4.6.1. Company Overview
11.4.6.2. Company Footprints
11.4.6.3. Production Locations
11.4.6.4. Product Portfolio
11.4.6.5. Competitors & Customers
11.4.6.6. Subsidiaries & Parent Organization
11.4.6.7. Recent Developments
11.4.6.8. Financial Analysis
11.4.6.9. Profitability
11.4.6.10. Revenue Share
11.4.7. Endurance Technologies Limited
11.4.7.1. Company Overview
11.4.7.2. Company Footprints
11.4.7.3. Production Locations
11.4.7.4. Product Portfolio
11.4.7.5. Competitors & Customers
11.4.7.6. Subsidiaries & Parent Organization
11.4.7.7. Recent Developments
11.4.7.8. Financial Analysis
11.4.7.9. Profitability
11.4.7.10. Revenue Share
11.4.8. FCS Auto
11.4.8.1. Company Overview
11.4.8.2. Company Footprints
11.4.8.3. Production Locations
11.4.8.4. Product Portfolio
11.4.8.5. Competitors & Customers
11.4.8.6. Subsidiaries & Parent Organization
11.4.8.7. Recent Developments
11.4.8.8. Financial Analysis
11.4.8.9. Profitability
11.4.8.10. Revenue Share
11.4.9. Halla Holdings Corp.
11.4.9.1. Company Overview
11.4.9.2. Company Footprints
11.4.9.3. Production Locations
11.4.9.4. Product Portfolio
11.4.9.5. Competitors & Customers
11.4.9.6. Subsidiaries & Parent Organization
11.4.9.7. Recent Developments
11.4.9.8. Financial Analysis
11.4.9.9. Profitability
11.4.9.10. Revenue Share
11.4.10. Hitachi Automotive Systems, Ltd.
11.4.10.1. Company Overview
11.4.10.2. Company Footprints
11.4.10.3. Production Locations
11.4.10.4. Product Portfolio
11.4.10.5. Competitors & Customers
11.4.10.6. Subsidiaries & Parent Organization
11.4.10.7. Recent Developments
11.4.10.8. Financial Analysis
11.4.10.9. Profitability
11.4.10.10. Revenue Share
11.4.11. Kalyani Forge ltd.
11.4.11.1. Company Overview
11.4.11.2. Company Footprints
11.4.11.3. Production Locations
11.4.11.4. Product Portfolio
11.4.11.5. Competitors & Customers
11.4.11.6. Subsidiaries & Parent Organization
11.4.11.7. Recent Developments
11.4.11.8. Financial Analysis
11.4.11.9. Profitability
11.4.11.10. Revenue Share
11.4.12. Kobe Suspensions
11.4.12.1. Company Overview
11.4.12.2. Company Footprints
11.4.12.3. Production Locations
11.4.12.4. Product Portfolio
11.4.12.5. Competitors & Customers
11.4.12.6. Subsidiaries & Parent Organization
11.4.12.7. Recent Developments
11.4.12.8. Financial Analysis
11.4.12.9. Profitability
11.4.12.10. Revenue Share
11.4.13. KYB
11.4.13.1. Company Overview
11.4.13.2. Company Footprints
11.4.13.3. Production Locations
11.4.13.4. Product Portfolio
11.4.13.5. Competitors & Customers
11.4.13.6. Subsidiaries & Parent Organization
11.4.13.7. Recent Developments
11.4.13.8. Financial Analysis
11.4.13.9. Profitability
11.4.13.10. Revenue Share
11.4.14. LEACREE Company
11.4.14.1. Company Overview
11.4.14.2. Company Footprints
11.4.14.3. Production Locations
11.4.14.4. Product Portfolio
11.4.14.5. Competitors & Customers
11.4.14.6. Subsidiaries & Parent Organization
11.4.14.7. Recent Developments
11.4.14.8. Financial Analysis
11.4.14.9. Profitability
11.4.14.10. Revenue Share
11.4.15. Magneti Marelli S.p.A.
11.4.15.1. Company Overview
11.4.15.2. Company Footprints
11.4.15.3. Production Locations
11.4.15.4. Product Portfolio
11.4.15.5. Competitors & Customers
11.4.15.6. Subsidiaries & Parent Organization
11.4.15.7. Recent Developments
11.4.15.8. Financial Analysis
11.4.15.9. Profitability
11.4.15.10. Revenue Share
11.4.16. Mubea Suspension Pvt. Ltd.
11.4.16.1. Company Overview
11.4.16.2. Company Footprints
11.4.16.3. Production Locations
11.4.16.4. Product Portfolio
11.4.16.5. Competitors & Customers
11.4.16.6. Subsidiaries & Parent Organization
11.4.16.7. Recent Developments
11.4.16.8. Financial Analysis
11.4.16.9. Profitability
11.4.16.10. Revenue Share
11.4.17. QBAutomotive
11.4.17.1. Company Overview
11.4.17.2. Company Footprints
11.4.17.3. Production Locations
11.4.17.4. Product Portfolio
11.4.17.5. Competitors & Customers
11.4.17.6. Subsidiaries & Parent Organization
11.4.17.7. Recent Developments
11.4.17.8. Financial Analysis
11.4.17.9. Profitability
11.4.17.10. Revenue Share
11.4.18. Ride Control, LLC
11.4.18.1. Company Overview
11.4.18.2. Company Footprints
11.4.18.3. Production Locations
11.4.18.4. Product Portfolio
11.4.18.5. Competitors & Customers
11.4.18.6. Subsidiaries & Parent Organization
11.4.18.7. Recent Developments
11.4.18.8. Financial Analysis
11.4.18.9. Profitability
11.4.18.10. Revenue Share
11.4.19. Robert Bosch GmbH
11.4.19.1. Company Overview
11.4.19.2. Company Footprints
11.4.19.3. Production Locations
11.4.19.4. Product Portfolio
11.4.19.5. Competitors & Customers
11.4.19.6. Subsidiaries & Parent Organization
11.4.19.7. Recent Developments
11.4.19.8. Financial Analysis
11.4.19.9. Profitability
11.4.19.10. Revenue Share
11.4.20. Samavardhana Motherson Group
11.4.20.1. Company Overview
11.4.20.2. Company Footprints
11.4.20.3. Production Locations
11.4.20.4. Product Portfolio
11.4.20.5. Competitors & Customers
11.4.20.6. Subsidiaries & Parent Organization
11.4.20.7. Recent Developments
11.4.20.8. Financial Analysis
11.4.20.9. Profitability
11.4.20.10. Revenue Share
11.4.21. Tenneco Inc.,
11.4.21.1. Company Overview
11.4.21.2. Company Footprints
11.4.21.3. Production Locations
11.4.21.4. Product Portfolio
11.4.21.5. Competitors & Customers
11.4.21.6. Subsidiaries & Parent Organization
11.4.21.7. Recent Developments
11.4.21.8. Financial Analysis
11.4.21.9. Profitability
11.4.21.10. Revenue Share
11.4.22. ZF Friedrichshafen AG
11.4.22.1. Company Overview
11.4.22.2. Company Footprints
11.4.22.3. Production Locations
11.4.22.4. Product Portfolio
11.4.22.5. Competitors & Customers
11.4.22.6. Subsidiaries & Parent Organization
11.4.22.7. Recent Developments
11.4.22.8. Financial Analysis
11.4.22.9. Profitability
11.4.22.10. Revenue Share
11.4.23. Other Key Players
11.4.23.1. Company Overview
11.4.23.2. Company Footprints
11.4.23.3. Production Locations
11.4.23.4. Product Portfolio
11.4.23.5. Competitors & Customers
11.4.23.6. Subsidiaries & Parent Organization
11.4.23.7. Recent Developments
11.4.23.8. Financial Analysis
11.4.23.9. Profitability
11.4.23.10. Revenue Share
List of Table
Table 1: Global Suspension Parts Pricing
Table 2: Global Automotive Suspension Parts Market Size & Forecast, Volume (Million Units), by Suspension Parts Type, 2017‒2031
Table 3: Global Automotive Suspension Parts Market Size & Forecast, Value (US$ Mn), by Suspension Parts Type, 2017‒2031
Table 4: Global Automotive Suspension Parts Market Size & Forecast, Volume (Million Units), by Technology Type, 2017‒2031
Table 5: Global Automotive Suspension Parts Market Size & Forecast, Value (US$ Mn), by Technology Type, 2017‒2031
Table 6: Global Automotive Suspension Parts Market Size & Forecast, Volume (Million Units), by Vehicle Type, 2017‒2031
Table 7: Global Automotive Suspension Parts Market Size & Forecast, Value (US$ Mn), by Vehicle Type, 2017‒2031
Table 8: Global Automotive Suspension Parts Market Size & Forecast, Volume (Million Units), by Sales Channel, 2017‒2031
Table 9: Global Automotive Suspension Parts Market Size & Forecast, Value (US$ Mn), by Sales Channel, 2017‒2031
Table 10: Global Automotive Suspension Parts Market Size & Forecast, Volume (Million Units), by Region, 2017‒2031
Table 11: Global Automotive Suspension Parts Market Size & Forecast, Revenue (US$ Mn), by Region, 2017‒2031
Table 12: Americas Automotive Suspension Parts Market Size & Forecast, Volume (Million Units), by Suspension Parts Type, 2017‒2031
Table 13: Americas Automotive Suspension Parts Market Size & Forecast, Value (US$ Mn), by Suspension Parts Type, 2017‒2031
Table 14: Americas Automotive Suspension Parts Market Size & Forecast, Volume (Million Units), by Technology Type, 2017‒2031
Table 15: Americas Automotive Suspension Parts Market Size & Forecast, Value (US$ Mn), by Technology Type, 2017‒2031
Table 16: Americas Automotive Suspension Parts Market Size & Forecast, Volume (Million Units), by Vehicle Type, 2017‒2031
Table 17: Americas Automotive Suspension Parts Market Size & Forecast, Value (US$ Mn), by Vehicle Type, 2017‒2031
Table 18: Americas Automotive Suspension Parts Market Size & Forecast, Volume (Million Units), by Sales Channel, 2017‒2031
Table 19: Americas Automotive Suspension Parts Market Size & Forecast, Value (US$ Mn), by Sales Channel, 2017‒2031
Table 20: Americas Automotive Suspension Parts Market Size & Forecast, Volume (Million Units), by Country & Sub-region, 2017‒2031
Table 21: Americas Automotive Suspension Parts Market Size & Forecast, Revenue (US$ Mn), by Country & Sub-region, 2017‒2031
Table 22: Europe Automotive Suspension Parts Market Size & Forecast, Volume (Million Units), by Suspension Parts Type, 2017‒2031
Table 23: Europe Automotive Suspension Parts Market Size & Forecast, Value (US$ Mn), by Suspension Parts Type, 2017‒2031
Table 24: Europe Automotive Suspension Parts Market Size & Forecast, Volume (Million Units), by Technology Type, 2017‒2031
Table 25: Europe Automotive Suspension Parts Market Size & Forecast, Value (US$ Mn), by Technology Type, 2017‒2031
Table 26: Europe Automotive Suspension Parts Market Size & Forecast, Volume (Million Units), by Vehicle Type, 2017‒2031
Table 27: Europe Automotive Suspension Parts Market Size & Forecast, Value (US$ Mn), by Vehicle Type, 2017‒2031
Table 28: Europe Automotive Suspension Parts Market Size & Forecast, Volume (Million Units), by Sales Channel, 2017‒2031
Table 29: Europe Automotive Suspension Parts Market Size & Forecast, Value (US$ Mn), by Sales Channel, 2017‒2031
Table 30: Europe Automotive Suspension Parts Market Size & Forecast, Volume (Million Units), by Country & Sub-region, 2017‒2031
Table 31: Europe Automotive Suspension Parts Market Size & Forecast, Revenue (US$ Mn), by Country & Sub-region, 2017‒2031
Table 32: Asia Pacific Automotive Suspension Parts Market Size & Forecast, Volume (Million Units), by Suspension Parts Type, 2017‒2031
Table 33: Asia Pacific Automotive Suspension Parts Market Size & Forecast, Value (US$ Mn), by Suspension Parts Type, 2017‒2031
Table 34: Asia Pacific Automotive Suspension Parts Market Size & Forecast, Volume (Million Units), by Technology Type, 2017‒2031
Table 35: Asia Pacific Automotive Suspension Parts Market Size & Forecast, Value (US$ Mn), by Technology Type, 2017‒2031
Table 36: Asia Pacific Automotive Suspension Parts Market Size & Forecast, Volume (Million Units), by Vehicle Type, 2017‒2031
Table 37: Asia Pacific Automotive Suspension Parts Market Size & Forecast, Value (US$ Mn), by Vehicle Type, 2017‒2031
Table 38: Asia Pacific Automotive Suspension Parts Market Size & Forecast, Volume (Million Units), by Sales Channel, 2017‒2031
Table 39: Asia Pacific Automotive Suspension Parts Market Size & Forecast, Value (US$ Mn), by Sales Channel, 2017‒2031
Table 40: Asia Pacific Automotive Suspension Parts Market Size & Forecast, Volume (Million Units), by Country & Sub-region, 2017‒2031
Table 41: Asia Pacific Automotive Suspension Parts Market Size & Forecast, Revenue (US$ Mn), by Country & Sub-region, 2017‒2031
Table 42: Middle East & Africa Automotive Suspension Parts Market Size & Forecast, Volume (Million Units), by Suspension Parts Type, 2017‒2031
Table 43: Middle East & Africa Automotive Suspension Parts Market Size & Forecast, Value (US$ Mn), by Suspension Parts Type, 2017‒2031
Table 44: Middle East & Africa Automotive Suspension Parts Market Size & Forecast, Volume (Million Units), by Technology Type, 2017‒2031
Table 45: Middle East & Africa Automotive Suspension Parts Market Size & Forecast, Value (US$ Mn), by Technology Type, 2017‒2031
Table 46: Middle East & Africa Automotive Suspension Parts Market Size & Forecast, Volume (Million Units), by Vehicle Type, 2017‒2031
Table 47: Middle East & Africa Automotive Suspension Parts Market Size & Forecast, Value (US$ Mn), by Vehicle Type, 2017‒2031
Table 48: Middle East & Africa Automotive Suspension Parts Market Size & Forecast, Volume (Million Units), by Sales Channel, 2017‒2031
Table 49: Middle East & Africa Automotive Suspension Parts Market Size & Forecast, Value (US$ Mn), by Sales Channel, 2017‒2031
Table 50: Middle East & Africa Automotive Suspension Parts Market Size & Forecast, Volume (Million Units), by Country & Sub-region, 2017‒2031
Table 51: Middle East & Africa Automotive Suspension Parts Market Size & Forecast, Revenue (US$ Mn), by Country & Sub-region, 2017‒2031
List of Figures
Figure 1: Global Automotive Suspension Parts Market Volume (Million Units) Forecast, 2017–2031
Figure 2: Global Automotive Suspension Parts Market Revenue (US$ Million) Forecast, 2017–2031
Figure 3: Key Segment Analysis for Global
Figure 4: Global Automotive Suspension Parts Market Size & Forecast, Revenue (US$ Mn), 2017‒2031
Figure 5: Global Automotive Suspension Parts Market Size & Forecast, Revenue (US$ Mn), by Suspension Parts Type, 2017‒2031
Figure 6: Global Market Attractiveness, Value (US$ Mn), by Suspension Parts Type, 2022‒2031
Figure 7: Global Automotive Suspension Parts Market Size & Forecast, Revenue (US$ Mn), by Technology Type, 2017‒2031
Figure 8: Global Market Attractiveness, Value (US$ Mn), by Technology Type, 2022‒2031
Figure 9: Global Automotive Suspension Parts Market Size & Forecast, Revenue (US$ Mn), by Vehicle Type, 2017‒2031
Figure 10: Global Market Attractiveness, Value (US$ Mn), by Vehicle Type, 2022‒2031
Figure 11: Global Automotive Suspension Parts Market Size & Forecast, Revenue (US$ Mn), by Sales Channel, 2017‒2031
Figure 12: Global Market Attractiveness, Value (US$ Mn), by Sales Channel, 2022‒2031
Figure 13: Global Automotive Suspension Parts Market Size & Forecast, Revenue (US$ Mn), by Region, 2017‒2031
Figure 14: Global Market Attractiveness, Value (US$ Mn), by Region, 2022‒2031
Figure 15: Americas Automotive Suspension Parts Market Size & Forecast, Revenue (US$ Mn), by Suspension Parts Type, 2017‒2031
Figure 16: Americas Market Attractiveness, Value (US$ Mn), by Suspension Parts Type, 2022‒2031
Figure 17: Americas Automotive Suspension Parts Market Size & Forecast, Revenue (US$ Mn), by Technology Type, 2017‒2031
Figure 18: Americas Market Attractiveness, Value (US$ Mn), by Technology Type, 2022‒2031
Figure 19: Americas Automotive Suspension Parts Market Size & Forecast, Revenue (US$ Mn), by Vehicle Type, 2017‒2031
Figure 20: Americas Market Attractiveness, Value (US$ Mn), by Vehicle Type, 2022‒2031
Figure 21: Americas Automotive Suspension Parts Market Size & Forecast, Revenue (US$ Mn), by Sales Channel, 2017‒2031
Figure 22: Americas Market Attractiveness, Value (US$ Mn), by Sales Channel, 2022‒2031
Figure 23: Americas Automotive Suspension Parts Market Size & Forecast, Revenue (US$ Mn), by Country & Sub-region, 2017‒2031
Figure 24: Americas Market Attractiveness, Value (US$ Mn), by Country & Sub-region, 2022‒2031
Figure 25: Europe Automotive Suspension Parts Market Size & Forecast, Revenue (US$ Mn), by Suspension Parts Type, 2017‒2031
Figure 26: Europe Market Attractiveness, Value (US$ Mn), by Suspension Parts Type, 2022‒2031
Figure 27: Europe Automotive Suspension Parts Market Size & Forecast, Revenue (US$ Mn), by Technology Type, 2017‒2031
Figure 28: Europe Market Attractiveness, Value (US$ Mn), by Technology Type, 2022‒2031
Figure 29: Europe Automotive Suspension Parts Market Size & Forecast, Revenue (US$ Mn), by Vehicle Type, 2017‒2031
Figure 30: Europe Market Attractiveness, Value (US$ Mn), by Vehicle Type, 2022‒2031
Figure 31: Europe Automotive Suspension Parts Market Size & Forecast, Revenue (US$ Mn), by Sales Channel, 2017‒2031
Figure 32: Europe Market Attractiveness, Value (US$ Mn), by Sales Channel, 2022‒2031
Figure 33: Europe Automotive Suspension Parts Market Size & Forecast, Revenue (US$ Mn), by Country & Sub-region, 2017‒2031
Figure 34: Europe Market Attractiveness, Value (US$ Mn), by Country & Sub-region, 2022‒2031
Figure 35: Asia Pacific Automotive Suspension Parts Market Size & Forecast, Revenue (US$ Mn), by Suspension Parts Type, 2017‒2031
Figure 36: Asia Pacific Market Attractiveness, Value (US$ Mn), by Suspension Parts Type, 2022‒2031
Figure 37: Asia Pacific Automotive Suspension Parts Market Size & Forecast, Revenue (US$ Mn), by Technology Type, 2017‒2031
Figure 38: Asia Pacific Market Attractiveness, Value (US$ Mn), by Technology Type, 2022‒2031
Figure 39: Asia Pacific Automotive Suspension Parts Market Size & Forecast, Revenue (US$ Mn), by Vehicle Type, 2017‒2031
Figure 40: Asia Pacific Market Attractiveness, Value (US$ Mn), by Vehicle Type, 2022‒2031
Figure 41: Asia Pacific Automotive Suspension Parts Market Size & Forecast, Revenue (US$ Mn), by Sales Channel, 2017‒2031
Figure 42: Asia Pacific Market Attractiveness, Value (US$ Mn), by Sales Channel, 2022‒2031
Figure 43: Asia Pacific Automotive Suspension Parts Market Size & Forecast, Revenue (US$ Mn), by Country & Sub-region, 2017‒2031
Figure 44: Asia Pacific Market Attractiveness, Value (US$ Mn), by Country & Sub-region, 2022‒2031
Figure 45: Middle East & Africa Automotive Suspension Parts Market Size & Forecast, Revenue (US$ Mn), by Suspension Parts Type, 2017‒2031
Figure 46: Middle East & Africa Market Attractiveness, Value (US$ Mn), by Suspension Parts Type, 2022‒2031
Figure 47: Middle East & Africa Automotive Suspension Parts Market Size & Forecast, Revenue (US$ Mn), by Technology Type, 2017‒2031
Figure 48: Middle East & Africa Market Attractiveness, Value (US$ Mn), by Technology Type, 2022‒2031
Figure 49: Middle East & Africa Automotive Suspension Parts Market Size & Forecast, Revenue (US$ Mn), by Vehicle Type, 2017‒2031
Figure 50: Middle East & Africa Market Attractiveness, Value (US$ Mn), by Vehicle Type, 2022‒2031
Figure 51: Middle East & Africa Automotive Suspension Parts Market Size & Forecast, Revenue (US$ Mn), by Sales Channel, 2017‒2031
Figure 52: Middle East & Africa Market Attractiveness, Value (US$ Mn), by Sales Channel, 2022‒2031
Figure 53: Middle East & Africa Automotive Suspension Parts Market Size & Forecast, Revenue (US$ Mn), by Country & Sub-region, 2017‒2031
Figure 54: Middle East & Africa Market Attractiveness, Value (US$ Mn), by Country & Sub-region, 2022‒2031
Copyright © Transparency Market Research, Inc. All Rights reserved
Trust Online

Automotive Suspension Parts Market
