Advanced Materials Market-An Overview
The use of advanced materials is an emerging trend which is helping transform the manufacturing industry around the world and has particularly been useful in the replacement of plastic and metal components with ceramic and composite products in high-octane applications. The advantage of using ceramics and composites is that they are lightweight, possess great strength and can resist abrasion very well.
Ceramics demand has also seen an upward curve because of its usage in medical devices production. Ceramics uptake will continue to stay high as the healthcare industry grows further and the need for medical attention also rises during the forecast period. Technologies that are on the rise and innovations in product development and manufacturing are estimated to help maintain the high demand for advanced materials during the forecast period. Increasing expenditure on research and development activities is also anticipated to have a substantial impact on the global advanced materials market. Some of the industries where advanced materials could be used in and as a result, lead to large profits include the aerospace industry, automotive industry etc.
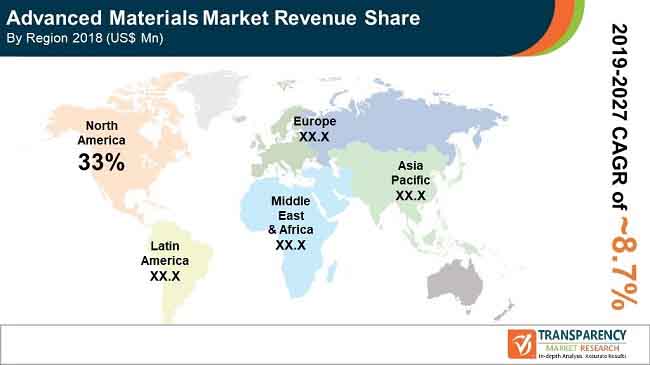
Europe and North America are the important regions for the advanced materials market worldwide. Both regions combined constitute more than 50% of the total advanced materials market. The reason for both regions' stronghold on the advanced materials market is due to the availability of large production capacity and a greater sophistication due to the presence of advanced technologies. North America will continue to stay on top, as far as the growth rate is concerned.
The advanced materials market, however, has its own challenges as well. One of them is the pricing of the advanced materials, which is very high when compared with conventional materials. The large energy costs that go into the manufacturing of advanced ceramics could prove to be a bottleneck in future. Advanced ceramics production is a time-consuming process and occurs at high temperatures in a controlled environment. As a result, owing to the large manufacturing costs, the price of advanced ceramics is also on the higher side.
Leading Players in Global Advanced Materials Market
1. Preface
1.1. Report Scope and Market Segmentation
1.2. Research Highlights
2. Assumptions and Research Methodology
2.1. Assumptions and Acronyms Used
2.2. Research Methodology
3. Executive Summary
3.1. Market Snapshot, Indicative (US$ Bn)
3.2. Top Trends
4. Market Overview
4.1. Product Overview
4.2. Market Indicators
5. Market Dynamics
5.1. Drivers and Restraints Snapshot Analysis
5.1.1. Drivers
5.1.2. Restraints
5.1.3. Opportunities
5.2. Global Advanced Materials Market Analysis and Forecast
5.3. Global R&D Expenditure on Advanced Materials
5.4. Use of Simulation and Big Data in Advanced Materials
5.5. Porter’s Analysis
5.5.1. Threat of Substitutes
5.5.2. Bargaining Power of Buyers
5.5.3. Bargaining Power of Suppliers
5.5.4. Threat of New Entrants
5.5.5. Degree of Competition
5.6. Value Chain Analysis
5.7. Advanced Materials Market Outlook
6. Advanced Materials Market Analysis, by Product
6.1. Key Findings
6.2. Introduction
6.3. Product Comparison Matrix
6.4. Global Advanced Materials Market Value Share Analysis, by Product
6.5. Global Advanced Materials Market Forecast, By Product
6.5.1. Ceramics
6.5.2. Glasses
6.5.3. Polymers
6.5.4. Composites
6.5.5. Metal & Alloys
6.6. Global Advanced Materials Market Analysis, by Product
6.7. Global Advanced Materials Market Attractiveness Analysis, by Product
7. Advanced Materials Market Analysis, by Application
7.1. Key Findings
7.2. Introduction
7.3. Application Comparison Matrix
7.4. Global Advanced Materials Market Value Share Analysis, by Application
7.5. Global Advanced Materials Market Forecast, by Application
7.5.1. Medical devices
7.5.2. Automotive
7.5.3. Aerospace
7.5.4. Electricals & Electronics
7.5.5. Industrial
7.5.6. Power
7.5.7. Others
7.6. Global Advanced Materials Market Analysis, by Application
7.7. Global Advanced Materials Market Attractiveness Analysis, by Application
8. Global Advanced Materials Market Analysis by Region
8.1. Global Market Size Growth Scenario, by Region, 2018
8.2. Global Advanced Materials Market Value Share Analysis, by Region
8.3. Global Advanced Materials Market Forecast, by Region
8.3.1. North America
8.3.2. Latin America
8.3.3. Europe
8.3.4. Asia Pacific
8.3.5. Middle East and Africa
8.4. Global Advanced Materials Market Attractiveness Analysis, by Region
9. North America Advanced Materials Market Analysis
9.1. Key Findings
9.2. North America Advanced Materials Market Overview
9.2.1. North America Advanced Materials Market Value Share Analysis, by Product
9.2.2. North America Advanced Materials Market Forecast, by Product
9.2.3. North America Advanced Materials Market Value Share Analysis, by Application
9.2.4. North America Advanced Materials Market Forecast, by Application
9.2.5. North America Advanced Materials Market Value Share Analysis, by Country
9.2.6. North America Advanced Materials Market Forecast, by Country
9.2.6.1. U.S.
9.2.6.2. Canada
9.3. North America Advanced Materials Market Attractiveness Analysis
9.4. North America Advanced Materials Market Trends
10. Latin America Advanced Materials Market Analysis
10.1. Key Findings
10.2. Latin America Advanced Materials Market Overview
10.2.1. Latin America Advanced Materials Market Value Share Analysis, by Product
10.2.2. Latin America Advanced Materials Market Forecast, by Product
10.2.3. Latin America Advanced Materials Market Value Share Analysis, by Application
10.2.4. Latin America Advanced Materials Market Forecast, by Application
10.2.5. Latin America Advanced Materials Market Value Share Analysis, by Country
10.2.6. Latin America Advanced Materials Market Forecast, by Country
10.2.6.1. Brazil
10.2.6.2. Mexico
10.2.6.3. Rest of Latin America
10.3. Latin America Advanced Materials Market Attractiveness Analysis
10.4. Latin America Advanced Materials Market Trends
11. Europe Advanced Materials Market Analysis
11.1. Key Findings
11.2. Europe Advanced Materials Market Overview
11.2.1. Europe Advanced Materials Market Value Share Analysis, by Product
11.2.2. Europe Advanced Materials Market Forecast, by Product
11.2.3. Europe Advanced Materials Market Value Share Analysis, by Application
11.2.4. Europe Advanced Materials Market Forecast, by Application
11.2.5. Europe Advanced Materials Market Value Share Analysis, by Country
11.2.6. Europe Advanced Materials Market Forecast, by Country
11.2.6.1. Germany
11.2.6.2. France
11.2.6.3. U.K.
11.2.6.4. Spain
11.2.6.5. Italy
11.2.6.6. Rest of Europe
11.3. Europe Advanced Materials Market Attractiveness Analysis
11.4. Europe Advanced Materials Market Trends
12. Asia Pacific Advanced Materials Market Analysis
12.1. Key Findings
12.2. Asia Pacific Advanced Materials Market Overview
12.2.1. Asia Pacific Advanced Materials Market Value Share Analysis, by Product
12.2.2. Asia Pacific Advanced Materials Market Forecast, by Product
12.2.3. Asia Pacific Advanced Materials Market Value Share Analysis, by Application
12.2.4. Asia Pacific Advanced Materials Market Forecast, by Application
12.2.5. Asia Pacific Advanced Materials Market Value Share Analysis, by Country
12.2.6. Asia Pacific Advanced Materials Market Forecast, by Country
12.2.6.1. China
12.2.6.2. Japan
12.2.6.3. India
12.2.6.4. ASEAN
12.2.6.5. Rest of Asia Pacific
12.3. Asia Pacific Advanced Materials Market Attractiveness Analysis
12.4. Asia Pacific Advanced Materials Market Trends
13. Middle East and Africa Advanced Materials Market Analysis
13.1. Key Findings
13.2. Middle East and Africa Advanced Materials Market Overview
13.2.1. Middle East and Africa Advanced Materials Market Value Share Analysis, by Product
13.2.2. Middle East and Africa Advanced Materials Market Forecast, by Product
13.2.3. Middle East and Africa Advanced Materials Market Value Share Analysis, by Application
13.2.4. Middle East and Africa Advanced Materials Market Forecast, by Application
13.2.5. Middle East and Africa Advanced Materials Market Value Share Analysis, by Country
13.2.6. Middle East and Africa Advanced Materials Market Forecast, by Country
13.2.6.1. GCC
13.2.6.2. South Africa
13.2.6.3. Rest of Middle East and Africa
13.3. Middle East and Africa Advanced Materials Market Attractiveness Analysis
13.4. Middle East and Africa Advanced Materials Market Trends
14. Competition Landscape
14.1. Advanced Materials Market Share Analysis by Company (2018)
14.2. Company Competition Matrix
14.3. Company Profiles
14.3.1. 3M Advanced Materials
14.3.1.1. Company Description
14.3.1.2. Business Overview
14.3.1.3. SWOT Analysis
14.3.1.4. Strategic Overview
14.3.2. Cerion LLC
14.3.2.1. Company Description
14.3.2.2. Business Overview
14.3.3. Morgan Advanced Materials plc
14.3.3.1. Company Description
14.3.3.2. Business Overview
14.3.3.3. SWOT Analysis
14.3.3.4. Strategic Overview
14.3.4. Materion Corporation
14.3.4.1. Company Description
14.3.4.2. Business Overview
14.3.4.3. SWOT Analysis
14.3.4.4. Strategic Overview
14.3.5. TATA Advanced Materials Limited
14.3.5.1. Company Description
14.3.5.2. Business Overview
14.3.5.3. SWOT Analysis
14.3.5.4. Strategic Overview
14.3.6. Hanwha Group
14.3.6.1. Company Description
14.3.6.2. Business Overview
14.3.6.3. SWOT Analysis
14.3.6.4. Strategic Overview
14.3.7. Huntsman International LLC
14.3.7.1. Company Description
14.3.7.2. Business Overview
14.3.7.3. SWOT Analysis
14.3.7.4. Strategic Overview
14.3.8. Hexcel Corporation
14.3.8.1. Company Description
14.3.8.2. Business Overview
14.3.8.3. SWOT Analysis
14.3.8.4. Strategic Overview
14.3.9. Thomas Swan & Co. Ltd.
14.3.9.1. Company Description
14.3.9.2. Business Overview
14.3.9.3. Recent Developments
14.3.9.4. Strategic Overview
14.3.10. GR Advanced Materials Ltd (Rioch)
14.3.10.1. Company Description
14.3.10.2. Business Overview
14.3.11. Park Electrochemical Corp.
14.3.11.1. Company Description
14.3.11.2. Business Overview
14.3.11.3. SWOT Analysis
14.3.11.4. Strategic Overview
14.3.12. The Lubrizol Corporation
14.3.12.1. Company Description
14.3.12.2. Business Overview
14.3.13. Advanced Materials and Manufacturing Technologies, LLC
14.3.13.1. Company Description
14.3.13.2. Business Overview
15. Key Takeaways
List of Figures
Figure 01: Global Advanced Materials (Million Tons) and Market Size (US$ Bn) Forecast, 2018–2027
Figure 02(a): Global Advanced Materials Average Price (US$/Kg) 2018–2027
Figure 02(b): Global Advanced Materials Average Price (US$/Kg) 2018–2027
Figure 03: Global Advanced Materials Market Value Share Analysis, by Product, 2019 and 2027
Figure 04: Global Advanced Materials Market Revenue (US$ Bn) and Volume (Kilo Tons), by Ceramics, 2018–2027
Figure 05: Global Advanced Materials Market Revenue (US$ Bn) and Volume (Kilo Tons), by Glasses, 2018–2027
Figure 06: Global Advanced Materials Market Revenue (US$ Bn) and Volume (Kilo Tons), by Polymers, 2018–2027
Figure 07: Global Advanced Materials Market Revenue (US$ Bn) and Volume (Kilo Tons), by Composites, 2018–2027
Figure 08: Global Advanced Materials Market Revenue (US$ Bn) and Volume (Kilo Tons), by M&A, 2018–2027
Figure 09: Advanced Materials Market Attractiveness Analysis, by Product
Figure 10: Global Advanced Materials Market Value Share Analysis, by Application, 2019 and 2027
Figure 11: Global Advanced Materials Market Revenue (US$ Bn) and Volume (Kilo Tons), by Medical devices, 2018–2027
Figure 12: Global Advanced Materials Market Revenue (US$ Bn) and Volume (Kilo Tons), by Automotive, 2018–2027
Figure 13: Global Advanced Materials Market Revenue (US$ Bn) and Volume (Kilo Tons), by Aerospace, 2018–2027
Figure 14: Global Advanced Materials Market Revenue (US$ Bn) and Volume (Kilo Tons), by E&E, 2018–2027
Figure 15: Global Advanced Materials Market Revenue (US$ Bn) and Volume (Kilo Tons), by Industrial, 2018–2027
Figure 16: Global Advanced Materials Market Revenue (US$ Bn) and Volume (Kilo Tons), by Power, 2018–2027
Figure 17: Global Advanced Materials Market Revenue (US$ Bn) and Volume (Kilo Tons), by Others, 2018–2027
Figure 18: Advanced Materials Market Attractiveness Analysis, by Application
Figure 19: Global Advanced Materials Market Value Share Analysis, by Region, 2019 and 2027
Figure 20: Global Advanced Materials Market Attractiveness Analysis, by Region
Figure 21: North America Advanced Materials Market Revenue (US$ Bn) and Volume (Kilo Tons) Forecast, 2018–2027
Figure 22: North America Advanced Materials Market Revenue and Volume, Y-o-Y Growth Projections, 2018–2027
Figure 23: North America Advanced Materials Market Value Share Analysis, by Product, 2019 and 2027
Figure 24: North America Advanced Materials Market Value Share Analysis, by Application, 2019 and 2027
Figure 25: North America Advanced Materials Market Value Share Analysis, by Country, 2019 and 2027
Figure 26: Latin America Advanced Materials Market Revenue (US$ Bn) and Volume (Kilo Tons) Forecast, 2018–2027
Figure 27: Latin America Advanced Materials Market Revenue and Volume, Y-o-Y Growth Projections, 2018–2027
Figure 28: Latin America Advanced Materials Market Value Share Analysis, by Product, 2019 and 2027
Figure 29: Latin America Advanced Materials Market Value Share Analysis, by Application, 2019 and 2027
Figure 30: Latin America Advanced Materials Market Value Share Analysis, by Country, 2019 and 2027
Figure 31: Europe Advanced Materials Market Revenue (US$ Bn) and Volume (Kilo Tons) Forecast, 2018–2027
Figure 32: Europe Advanced Materials Market Revenue and Volume, Y-o-Y Growth Projections, 2018–2027
Figure 33: Europe Advanced Materials Market Value Share Analysis, by Product, 2019 and 2027
Figure 34: Europe Advanced Materials Market Value Share Analysis, by Application, 2019 and 2027
Figure 35: Europe Advanced Materials Market Value Share Analysis, by Country, 2019 and 2027
Figure 36: Asia Pacific Advanced Materials Market Revenue (US$ Mn) and Volume (Kilo Tons) Forecast, 2018–2027
Figure 37: Asia Pacific Advanced Materials Market Revenue and Volume, Y-o-Y Growth Projections, 2018–2027
Figure 38: Asia Pacific Advanced Materials Market Value Share Analysis, by Product, 2019 and 2027
Figure 39: Asia Pacific Advanced Materials Market Value Share Analysis, by Application, 2019 and 2027
Figure 40: Asia Pacific Advanced Materials Market Value Share Analysis, by Country, 2019 and 2027
Figure 41: Middle East & Africa Advanced Materials Market Revenue (US$ Mn) and Volume (Kilo Tons) Forecast, 2018–2027
Figure 42: Middle East & Africa Advanced Materials Market Revenue and Volume, Y-o-Y Growth Projections, 2018–2027
Figure 43: Middle East & Africa Advanced Materials Market Value Share Analysis, by Product, 2019 and 2027
Figure 44: Middle East & Africa Advanced Materials Market Value Share Analysis, by Application, 2019 and 2027
Figure 45: Latin America Advanced Materials Market Value Share Analysis, by Country, 2019 and 2027
Figure 46: Global Advanced Materials Market Share Analysis, by Company (2018)
List of Tables
Table 01: Global Advanced Materials Market Revenue (US$ Bn) and Volume (Kilo Tons) Forecast, by Product, 2018–2027
Table 02: Global Advanced Materials Market Revenue (US$ Bn) and Volume (Kilo Tons) Forecast, by Application, 2018–2027 (1/2)
Table 02: Global Advanced Materials Market Revenue (US$ Bn) and Volume (Kilo Tons) Forecast, by Application, 2018–2027 (2/2)
Table 03: Global Advanced Materials Market Revenue (US$ Bn) and Volume (Kilo Tons) Forecast, by Region, 2018–2027
Table 04: North America Advanced Materials Market Revenue (US$ Mn) and Volume (Kilo Tons) Forecast, by Product, 2018–2027
Table 05: North America Advanced Materials Market Revenue (US$ Mn) and Volume (Kilo Tons) Forecast, by Application, 2018–2027 (1/2)
Table 05: North America Advanced Materials Market Revenue (US$ Mn) and Volume (Kilo Tons) Forecast, by Application, 2018–2027 (2/2)
Table 06: North America Market Size Forecast (Kilo Tons) (US$ Mn), by Country, 2018–2027
Table 07: Latin America Advanced Materials Market Revenue (US$ Mn) and Volume (Kilo Tons) Forecast, by Product, 2018–2027
Table 08: Latin America Advanced Materials Market Revenue (US$ Mn) and Volume (Kilo Tons) Forecast, by Application, 2018–2027 (1/2)
Table 08: Latin America Advanced Materials Market Revenue (US$ Mn) and Volume (Kilo Tons) Forecast, by Application, 2018–2027 (2/2)
Table 09: Latin America Market Size Forecast (Kilo Tons) (US$ Mn), by Country, 2018–2027
Table 10: Europe Advanced Materials Market Revenue (US$ Mn) and Volume (Kilo Tons) Forecast, by Product, 2018–2027
Table 11: Europe Advanced Materials Market Revenue (US$ Mn) and Volume (Kilo Tons) Forecast, by Application, 2018–2027 (1/2)
Table 11: Europe Advanced Materials Market Revenue (US$ Mn) and Volume (Kilo Tons) Forecast, by Application, 2018–2027 (2/2)
Table 12: Europe Market Size Forecast (Kilo Tons) (US$ Mn), by Country, 2018–2027 (1/2)
Table 12: Europe Market Size Forecast (Kilo Tons) (US$ Mn), by Country, 2018–2027 (2/2)
Table 13: Asia Pacific Advanced Materials Market Revenue (US$ Mn) and Volume (Kilo Tons) Forecast, by Product, 2018–2027
Table 14: Asia Pacific Advanced Materials Market Revenue (US$ Mn) and Volume (Kilo Tons) Forecast, by Application, 2018–2027 (1/2)
Table 14: Asia Pacific Advanced Materials Market Revenue (US$ Mn) and Volume (Kilo Tons) Forecast, by Application, 2018–2027 (1/2)
Table 15: Asia Pacific Market Size Forecast (Kilo Tons) (US$ Mn), by Country, 2018–2027
Table 16: Middle East & Africa Advanced Materials Market Revenue (US$ Mn) and Volume (Kilo Tons) Forecast, by Product, 2018–2027
Table 17: Middle East & Africa Advanced Materials Market Revenue (US$ Mn) and Volume (Kilo Tons) Forecast, by Application, 2018–2027 (1/2)
Table 17: Middle East & Africa Advanced Materials Market Revenue (US$ Mn) and Volume (Kilo Tons) Forecast, by Application, 2018–2027 (2/2)
Table 18: Middle East and Africa Market Size Forecast (Kilo Tons) (US$ Mn), by Country, 2018–2027
Copyright © Transparency Market Research, Inc. All Rights reserved
Trust Online

Advanced Materials Market
