In order to address the coronavirus situation, Big Data and Artificial Intelligence (AI) are being successfully used. The AI is being leveraged to monitor cases, identify disease clusters, and predict future outbreaks. Such trends are creating incremental opportunities for companies in the artificial intelligence market. Stakeholders are taking efforts to develop early warning systems by extracting information from social media platforms and news sites to provide useful information about vulnerable regions.
AI-based triage systems are being provided by companies in the artificial intelligence market. However, a relatively small amount of buyers is opting for such technologies. Thus, companies are focusing mainly on AI-based mobile health apps, smart watches, cameras, and wearable devices to revive market growth.
The artificial intelligence market is expected to advance at an explosive CAGR of ~29% during the assessment period. However, high costs, lack of creativity in bots, and absence of ethics in the AI technology are raising concerns that AI could grow uncontrollably, leading to the well-known concept of AI singularity. Hence, companies are catering to productive applications for healthcare and education in order to use the technology for constructive purposes.
Companies are establishing stable business streams in AI-based educational tools to develop skills and testing systems. AI has the potential to drive efficiency, personalization, and streamline admin tasks to allow teachers the time and freedom to provide an understanding of complex learning concepts and adaptability in students.
Banks are most likely to benefit from AI, as banking stakeholders are gaining opportunity to rethink approaches toward people and various processes. Chatbots or digital personal assistant are among the most popular AI software in the banking sector, which helps to answer FAQs (Frequently Asked Questions) of customers. Companies in the artificial intelligence market are providing AI-enhanced security since bank data is a goldmine of personal and confidential information.
On the other hand, banking compliance and financial forecasting, with the help of AI, are creating value grab opportunities for companies in the artificial intelligence market. Automating manual compliance in cases of Know Your Customer and Anti-Money Laundering (AML) are becoming customary in banking services.
Computer vision, a subset of AI, is being used in self-driving automobiles. A recent and popular example of this is Elon Musk’s Tesla, which is exploiting computer vision at unprecedented levels for not only analyzing images but also individual pixels within the images. Carmakers are anticipated to use computer vision to conduct tests that validate a car’s ability to navigate safely in daily traffic.
Even as computer vision in self-driving cars is anticipated to revolutionize mobility services, the possibility of fatal accidents remains prominent. While establishing continuous R&D in automotive applications, companies in the artificial intelligence market are tapping into incremental opportunities in retail applications such as the Amazon Go checkout-free self-service retail stores.
Data-driven decisions and maintenance are being achieved with AI in the telecommunications sector. Companies in the artificial intelligence market are unlocking revenue opportunities in the ever-increasing and ever-evolving telecom sector by helping business leaders take data-driven decisions. AI is benefitting telecom operators to improve and optimize their network and infrastructure. This technology allows telecom companies to support monitoring of equipment, which prevents power outages and network disruptions that ensure productivity of employees.
AI employed with machine learning (ML) has made it easier to implement algorithms that can detect and respond to fraudulent activities in the telecom network. Such trends are contributing toward growth and expansion of the global artificial intelligence market.
Analysts’ Viewpoint
AI techniques are being employed to provide monitoring of patients in clinical settings during the coronavirus pandemic and determine an efficacious course of treatment to improve medical outcomes. The artificial intelligence market is expected to surpass the revenue of US$ 2.8 Bn by the end of 2030, owing to its vast number of applications in virtually all end-use cases. However, limitations of computer vision in autonomous cars are potentially inhibiting market growth. Hence, companies should employ computer vision in the agriculture sector to develop agricultural robots that benefit in soil and weather monitoring. AI is enabling verifications and compliance in telecoms to understand the difference between normal and faulty trends, and investigate anomalies by analyzing data.
Artificial Intelligence Market Forecast Till 2030
Artificial Intelligence Market Predicted to 29% CAGR During the Forecast Period.
The Players Involved in the Artificial Intelligence Market are Amazon Web Services (AWS), Brighterion, Inc., eGain Corporation, Google, Inc., IBM Corporation, Intel Corporationand others.
Growing advancements in Big Data analytics is increasing Demand Artificial Intelligence Market
The Artificial Intelligence Market Would Be Of Significant US$ 2.8 Trn.
1. Preface
1.1. Market Introduction
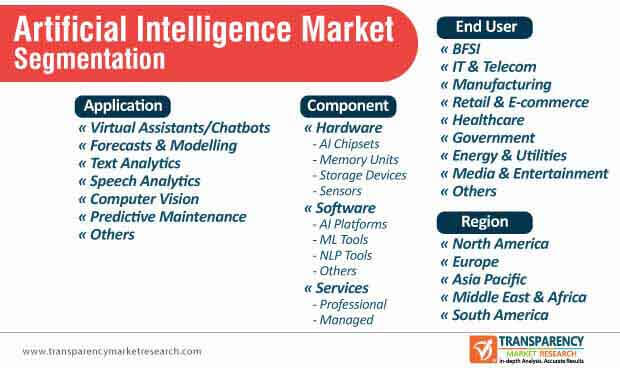
1.2. Market Segmentation
1.3. Key Research Objectives
2. Assumptions and Research Methodology
2.1. Research Methodology
2.1.1. List of Primary and Secondary Sources
2.2. Key Assumptions for Data Modelling
3. Executive Summary - Global Artificial Intelligence Market
4. Market Overview
4.1. Market Definition
4.2. Technology/ Product Roadmap
4.3. Market Factor Analysis
4.3.1. Forecast Factors
4.3.2. Ecosystem/ Value Chain Analysis
4.3.3. Market Dynamics (Growth Influencers)
4.3.3.1. Drivers
4.3.3.2. Restraints
4.3.3.3. Opportunities
4.3.3.4. Impact Analysis of Drivers and Restraints
4.4. COVID-19 Impact Analysis
4.4.1. Impact of COVID-19 on Artificial Intelligence Market
4.4.2. End-user Sentiment Analysis: Comparative Analysis on Spending
4.4.2.1. Increase in Spending
4.4.2.2. Decrease in Spending
4.4.3. Short Term and Long Term Impact on the Market
4.5. Market Opportunity Assessment – by Region (North America/ Europe/ Asia Pacific/ Middle East & Africa/ South America)
4.5.1. By Component
4.5.2. By Application
4.5.3. By End-user
4.6. Mergers & Acquisitions, Expansions
4.7. Overview of types of Artificial Intelligence
4.8. Overview of AI applications, by Industry
5. Global Artificial Intelligence Market Analysis and Forecast
5.1. Market Revenue Analysis (US$ Bn), 2015-2030
5.1.1. Historic Growth Trends, 2015-2019
5.1.2. Forecast Trends, 2020-2030
5.2. Market Volume Analysis (Thousand Units), 2015-2030
5.2.1. Historic Growth Trends, 2015-2019
5.2.2. Forecast Trends, 2020-2030
6. Global Artificial Intelligence Market Analysis, by Component
6.1. Overview and Definitions
6.2. Key Segment Analysis
6.3. Artificial Intelligence Market Size (US$ Bn) Forecast, by Component, 2018 - 2030
6.3.1. Hardware (000’)
6.3.1.1. AI Chipsets
6.3.1.2. Memory Units
6.3.1.3. Storage Devices
6.3.1.4. Sensors
6.3.2. Software
6.3.2.1. AI Platforms
6.3.2.2. ML Tools
6.3.2.3. NLP Tools
6.3.2.4. Others
6.3.3. Services
6.3.3.1. Professional
6.3.3.1.1. System Integration & Deployment
6.3.3.1.2. AI Technology Consulting
6.3.3.1.3. Support & Maintenance
6.3.3.2. Managed
7. Global Artificial Intelligence Market Analysis, by Application
7.1. Overview and Definitions
7.2. Key Segment Analysis
7.3. Artificial Intelligence Market Size (US$ Bn) Forecast, by Application, 2018 - 2030
7.3.1. Virtual Assistants/Chatbots
7.3.2. Forecasts & Modelling
7.3.3. Text Analytics
7.3.4. Speech Analytics
7.3.5. Computer Vision
7.3.6. Predictive Maintenance
7.3.7. Others
8. Global Artificial Intelligence Market Analysis, by End-user
8.1. Key Segment Analysis
8.2. Artificial Intelligence Market Size (US$ Bn) Forecast, by End-user, 2018 - 2030
8.2.1. BFSI
8.2.2. IT & Telecom
8.2.3. Manufacturing
8.2.4. Retail & E-commerce
8.2.5. Healthcare
8.2.6. Government
8.2.7. Energy & Utilities
8.2.8. Media & Entertainment
8.2.9. Others (Automotive, Agriculture, Travel & Transport, etc.)
9. Global Artificial Intelligence Market Analysis and Forecast, By Region
9.1. Key Findings
9.2. Artificial Intelligence Market Size (US$ Bn) Forecast, by Region, 2018 - 2030
9.2.1. North America
9.2.2. Europe
9.2.3. Asia Pacific
9.2.4. Middle East & Africa
9.2.5. South America
10. North America Artificial Intelligence Market Analysis
10.1. Regional Outlook
10.2. Artificial Intelligence Market Size (US$ Bn) Analysis and Forecast (2018 - 2030)
10.2.1. By Component
10.2.2. By Application
10.2.3. By End-user
10.3. Artificial Intelligence Market Size (US$ Bn) Forecast, by Country, 2018 - 2030
10.3.1. U.S.
10.3.2. Canada
10.3.3. Mexico
11. Europe Artificial Intelligence Market Analysis and Forecast
11.1. Regional Outlook
11.2. Artificial Intelligence Market Size (US$ Bn) Analysis and Forecast (2018 - 2030)
11.2.1. By Component
11.2.2. By Application
11.2.3. By End-user
11.3. Artificial Intelligence Market Size (US$ Bn) Forecast, by Country & Sub-region, 2018 - 2030
11.3.1. Germany
11.3.2. U.K.
11.3.3. France
11.3.4. Spain
11.3.5. Italy
11.3.6. Rest of Europe
12. APAC Artificial Intelligence Market Analysis and Forecast
12.1. Regional Outlook
12.2. Artificial Intelligence Market Size (US$ Bn) Analysis and Forecast (2018 - 2030)
12.2.1. By Component
12.2.2. By Application
12.2.3. By End-user
12.3. Artificial Intelligence Market Size (US$ Bn) Forecast, by Country & Sub-region, 2018 - 2030
12.3.1. China
12.3.2. India
12.3.3. Japan
12.3.4. ASEAN
12.3.5. Rest of Asia Pacific
13. Middle East & Africa (MEA) Artificial Intelligence Market Analysis and Forecast
13.1. Regional Outlook
13.2. Artificial Intelligence Market Size (US$ Bn) Analysis and Forecast (2018 - 2030)
13.2.1. By Component
13.2.2. By Application
13.2.3. By End-user
13.3. Artificial Intelligence Market Size (US$ Bn) Forecast, by Country & Sub-region, 2018 - 2030
13.3.1. Saudi Arabia
13.3.2. The United Arab Emirates
13.3.3. South Africa
13.3.4. Rest of Middle East & Africa (MEA)
14. South America Artificial Intelligence Market Analysis and Forecast
14.1. Regional Outlook
14.2. Artificial Intelligence Market Size (US$ Bn) Analysis and Forecast (2018 - 2030)
14.2.1. By Component
14.2.2. By Application
14.2.3. By End-user
14.3. Artificial Intelligence Market Size (US$ Bn) Forecast, by Country & Sub-region, 2018 - 2030
14.3.1. Brazil
14.3.2. Argentina
14.3.3. Rest of South America
15. Competition Landscape
15.1. Market Competition Matrix, by Leading Players
15.2. Market Revenue Share Analysis (%), by Leading Players (2020)
16. Company Profiles
16.1. Amazon Web Services (AWS)
16.1.1. Business Overview
16.1.2. Product Portfolio
16.1.3. Geographical Footprint
16.1.4. Revenue and Strategy
16.2. Accenture Plc
16.2.1. Business Overview
16.2.2. Product Portfolio
16.2.3. Geographical Footprint
16.2.4. Revenue and Strategy
16.3. Ayasdi AI LLC
16.3.1. Business Overview
16.3.2. Product Portfolio
16.3.3. Geographical Footprint
16.3.4. Revenue and Strategy
16.4. Dell Technologies Inc.
16.4.1. Business Overview
16.4.2. Product Portfolio
16.4.3. Geographical Footprint
16.4.4. Revenue and Strategy
16.5. Enlitic Inc.
16.5.1. Business Overview
16.5.2. Product Portfolio
16.5.3. Geographical Footprint
16.5.4. Revenue and Strategy
16.6. FICO
16.6.1. Business Overview
16.6.2. Product Portfolio
16.6.3. Geographical Footprint
16.6.4. Revenue and Strategy
16.7. Google, LLC
16.7.1. Business Overview
16.7.2. Product Portfolio
16.7.3. Geographical Footprint
16.7.4. Revenue and Strategy
16.8. H2O.ai
16.8.1. Business Overview
16.8.2. Product Portfolio
16.8.3. Geographical Footprint
16.8.4. Revenue and Strategy
16.9. Hewlett Packard Enterprise Development LP
16.9.1. Business Overview
16.9.2. Product Portfolio
16.9.3. Geographical Footprint
16.9.4. Revenue and Strategy
16.10. IBM Corporation
16.10.1. Business Overview
16.10.2. Product Portfolio
16.10.3. Geographical Footprint
16.10.4. Revenue and Strategy
16.11. Inspur Systems Inc.
16.11.1. Business Overview
16.11.2. Product Portfolio
16.11.3. Geographical Footprint
16.11.4. Revenue and Strategy
16.12. Intel Corporation
16.12.1. Business Overview
16.12.2. Product Portfolio
16.12.3. Geographical Footprint
16.12.4. Revenue and Strategy
16.13. Lunit Inc.
16.13.1. Business Overview
16.13.2. Product Portfolio
16.13.3. Geographical Footprint
16.13.4. Revenue and Strategy
16.14. Microsoft Corporation
16.14.1. Business Overview
16.14.2. Product Portfolio
16.14.3. Geographical Footprint
16.14.4. Revenue and Strategy
16.15. Nuance Communications, Inc.
16.15.1. Business Overview
16.15.2. Product Portfolio
16.15.3. Geographical Footprint
16.15.4. Revenue and Strategy
16.16. Oracle Corporation
16.16.1. Business Overview
16.16.2. Product Portfolio
16.16.3. Geographical Footprint
16.16.4. Revenue and Strategy
16.17. Salesforce.com, Inc.
16.17.1. Business Overview
16.17.2. Product Portfolio
16.17.3. Geographical Footprint
16.17.4. Revenue and Strategy
16.18. SAP SE
16.18.1. Business Overview
16.18.2. Product Portfolio
16.18.3. Geographical Footprint
16.18.4. Revenue and Strategy
16.19. SAS Institute Inc.
16.19.1. Business Overview
16.19.2. Product Portfolio
16.19.3. Geographical Footprint
16.19.4. Revenue and Strategy
16.20. understandAI GmbH
16.20.1. Business Overview
16.20.2. Product Portfolio
16.20.3. Geographical Footprint
16.20.4. Revenue and Strategy
17. Key Takeaways
List of Tables
Table 1: Acronyms Used in Artificial Intelligence Market
Table 2: North America Artificial Intelligence Market Revenue Analysis, by Country, 2020 - 2030 (US$ Bn)
Table 3: Europe Artificial Intelligence Market Revenue Analysis, by Country, 2020 - 2030 (US$ Bn)
Table 4: Asia Pacific Artificial Intelligence Market Revenue Analysis, by Country, 2020 - 2030 (US$ Bn)
Table 5: Middle East & Africa Artificial Intelligence Market Revenue Analysis, by Country, 2020 and 2030 (US$ Bn)
Table 6: South America Artificial Intelligence Market Revenue Analysis, by Country, 2020 - 2030 (US$ Bn)
Table 7: Forecast Factors: Relevance and Impact (1/2)
Table 8: Forecast Factors: Relevance and Impact (2/2)
Table 9: Mergers & Acquisitions, Partnerships
Table 10: Global Artificial Intelligence Market Value (US$ Bn) Forecast, by Component, 2018 – 2030 (1/3)
Table 11: Global Artificial Intelligence Market Value (US$ Bn) Forecast, by Component, by Hardware, 2018 – 2030
Table 12: Global Artificial Intelligence Market Volume (Thousand Units) Forecast, by Component, by Hardware, 2018 – 2030
Table 13: Global Artificial Intelligence Market Value (US$ Bn) Forecast, by Component, by Software, 2018 – 2030
Table 14: Global Artificial Intelligence Market Value (US$ Bn) Forecast, by Component, by Services, 2018 – 2030
Table 15: Global Artificial Intelligence Market Value (US$ Bn) Forecast, by Application, 2018 - 2030
Table 16: Global Artificial Intelligence Market Value (US$ Bn) Forecast, by End-user, 2018 - 2030
Table 17: Global Artificial Intelligence Market Value (US$ Bn) Forecast, by Region, 2018 - 2030
Table 18: North America Artificial Intelligence Market Value (US$ Bn) Forecast, by Component, 2018 – 2030 (1/3)
Table 19: North America Artificial Intelligence Market Value (US$ Bn) Forecast, by Component, by Hardware, 2018 – 2030
Table 20: North America Artificial Intelligence Market Volume (Thousand Units) Forecast, by Component, by Hardware, 2018 – 2030
Table 21: North America Artificial Intelligence Market Value (US$ Bn) Forecast, by Component, by Software, 2018 – 2030
Table 22: North America Artificial Intelligence Market Value (US$ Bn) Forecast, by Component, by Services, 2018 – 2030
Table 23: North America Artificial Intelligence Market Value (US$ Bn) Forecast, by Application, 2018 - 2030
Table 24: North America Artificial Intelligence Market Value (US$ Bn) Forecast, by End-user, 2018 - 2030
Table 25: North America Artificial Intelligence Market Value (US$ Bn) Forecast, by Country, 2018 - 2030
Table 26: The U.S. Artificial Intelligence Revenue CAGR Breakdown (%), by Growth Term
Table 27: Canada Artificial Intelligence Revenue CAGR Breakdown (%), by Growth Term
Table 28: Mexico Artificial Intelligence Revenue CAGR Breakdown (%), by Growth Term
Table 29: Europe Artificial Intelligence Market Value (US$ Bn) Forecast, by Component, 2018 – 2030 (1/3)
Table 30: Europe Artificial Intelligence Market Value (US$ Bn) Forecast, by Component, by Hardware, 2018 – 2030
Table 31: Europe Artificial Intelligence Market Volume (Thousand Units) Forecast, by Component, by Hardware, 2018 – 2030
Table 32: Europe Artificial Intelligence Market Value (US$ Bn) Forecast, by Component, by Software, 2018 – 2030
Table 33: Europe Artificial Intelligence Market Value (US$ Bn) Forecast, by Component, by Services, 2018 – 2030
Table 34: Europe Artificial Intelligence Market Value (US$ Bn) Forecast, by Application, 2018 - 2030
Table 35: Europe Artificial Intelligence Market Value (US$ Bn) Forecast, by End-user, 2018 - 2030
Table 36: Europe Artificial Intelligence Market Value (US$ Bn) Forecast, by Country, 2018 - 2030
Table 37: Germany Artificial Intelligence Revenue CAGR Breakdown (%), by Growth Term
Table 38: U.K. Artificial Intelligence Revenue CAGR Breakdown (%), by Growth Term
Table 39: France Artificial Intelligence Revenue CAGR Breakdown (%), by Growth Term
Table 40: Spain Artificial Intelligence Revenue CAGR Breakdown (%), by Growth Term
Table 41: Italy Artificial Intelligence Revenue CAGR Breakdown (%), by Growth Term
Table 42: Asia Pacific Artificial Intelligence Market Value (US$ Bn) Forecast, by Component, 2018 – 2030 (1/3)
Table 43: Asia Pacific Artificial Intelligence Market Value (US$ Bn) Forecast, by Component, by Hardware, 2018 – 2030
Table 44: Asia Pacific Artificial Intelligence Market Volume (Thousand Units) Forecast, by Component, by Hardware, 2018 – 2030
Table 45: Asia Pacific Artificial Intelligence Market Value (US$ Bn) Forecast, by Component, by Software, 2018 – 2030
Table 46: Asia Pacific Artificial Intelligence Market Value (US$ Bn) Forecast, by Component, by Services, 2018 – 2030
Table 47: Asia Pacific Artificial Intelligence Market Value (US$ Bn) Forecast, by Application, 2018 - 2030
Table 48: Asia Pacific Artificial Intelligence Market Value (US$ Bn) Forecast, by End-user, 2018 - 2030
Table 49: Asia Pacific Artificial Intelligence Market Value (US$ Bn) Forecast, by Country, 2018 - 2030
Table 50: China Artificial Intelligence Revenue CAGR Breakdown (%), by Growth Term
Table 51: India Artificial Intelligence Revenue CAGR Breakdown (%), by Growth Term
Table 52: Japan Artificial Intelligence Revenue CAGR Breakdown (%), by Growth Term
Table 53: ASEAN Artificial Intelligence Revenue CAGR Breakdown (%), by Growth Term
Table 54: Middle East & Africa Artificial Intelligence Market Value (US$ Bn) Forecast, by Component, 2018 – 2030 (1/3)
Table 55: Middle East & Africa Artificial Intelligence Market Value (US$ Bn) Forecast, by Component, by Hardware, 2018 – 2030
Table 56: Middle East & Africa Artificial Intelligence Market Volume (Thousand Units) Forecast, by Component, by Hardware, 2018 – 2030
Table 57: Middle East & Africa Artificial Intelligence Market Value (US$ Bn) Forecast, by Component, by Software, 2018 – 2030
Table 58: Middle East & Africa Artificial Intelligence Market Value (US$ Bn) Forecast, by Component, by Services, 2018 – 2030
Table 59: Middle East & Africa Artificial Intelligence Market Value (US$ Bn) Forecast, by Application, 2018 - 2030
Table 60: Middle East & Africa Artificial Intelligence Market Value (US$ Bn) Forecast, by End-user, 2018 - 2030
Table 61: Middle East & Africa Artificial Intelligence Market Value (US$ Bn) Forecast, by Country, 2018 - 2030
Table 62: UAE Artificial Intelligence Revenue CAGR Breakdown (%), by Growth Term
Table 63: Saudi Arabia Artificial Intelligence Revenue CAGR Breakdown (%), by Growth Term
Table 64: South Africa Artificial Intelligence Revenue CAGR Breakdown (%), by Growth Term
Table 65: South America Artificial Intelligence Market Value (US$ Bn) Forecast, by Component, 2018 – 2030 (1/3)
Table 66: South America Artificial Intelligence Market Value (US$ Bn) Forecast, by Component, by Hardware, 2018 – 2030
Table 67: South America Artificial Intelligence Market Volume (Thousand Units) Forecast, by Component, by Hardware, 2018 – 2030
Table 68: South America Artificial Intelligence Market Value (US$ Bn) Forecast, by Component, by Software, 2018 – 2030
Table 69: South America Artificial Intelligence Market Value (US$ Bn) Forecast, by Component, by Services, 2018 – 2030
Table 70: South America Artificial Intelligence Market Value (US$ Bn) Forecast, by Application, 2018 - 2030
Table 71: South America Artificial Intelligence Market Value (US$ Bn) Forecast, by End-user, 2018 - 2030
Table 72: South America Artificial Intelligence Market Value (US$ Bn) Forecast, by Country, 2018 - 2030
Table 73: Brazil Artificial Intelligence Revenue CAGR Breakdown (%), by Growth Term
Table 74: Argentina Artificial Intelligence Revenue CAGR Breakdown (%), by Growth Term
List of Figures
Figure 1: Global Artificial Intelligence Market Size (US$ Bn) Forecast, 2018–2030
Figure 2: Global Artificial Intelligence Market Revenue (US$ Bn) Opportunity Assessment, by Region, 2020E
Figure 3: Top Segment Analysis of Artificial Intelligence Market
Figure 4: Global Artificial Intelligence Market Revenue (US$ Bn) Opportunity Assessment, by Region, 2030F
Figure 5: Adoption of Artificial Intelligence During COVID-19, by Economies
Figure 6: Increase in Touchless Interactions during the Pandemic and Beyond
Figure 7: Rise in Adoption of Robots Due to COVID-19, by End-users
Figure 8: Comparison of Statistical Forecast Vs Artificial Intelligence Forecast on Outcome Accuracy
Figure 9: Global Artificial Intelligence Market Opportunity Assessment, by Component
Figure 10: Global Artificial Intelligence Market Opportunity Assessment, by Application
Figure 11: Global Artificial Intelligence Market Opportunity Assessment, by End-user
Figure 12: Global Artificial Intelligence Market Opportunity Assessment, by Region
Figure 13: Spending or Investment in Artificial Intelligence, by Industry
Figure 14: Current State of Application of AI in different industries
Figure 15: Global Artificial Intelligence Market Revenue (US$ Bn) Historic Trends, 2015 - 2019
Figure 16: Global Artificial Intelligence Market Revenue Opportunity (US$ Bn) Historic Trends, 2015 - 2019
Figure 17: Global Artificial Intelligence Market Volume (Thousand Units) Historic Trends, 2015 - 2019
Figure 18: Global Artificial Intelligence Market Volume (Thousand Units) Forecast, 2020 - 2030
Figure 19: Global Artificial Intelligence Market Value Share Analysis, by Component, 2020
Figure 20: Global Artificial Intelligence Market Value Share Analysis, by Component, 2030
Figure 21: Global Artificial Intelligence Market Absolute $ Opportunity (US$ Bn), by Hardware, 2020 – 2030
Figure 22: Global Artificial Intelligence Market Absolute $ Opportunity (US$ Bn), by Software, 2020 – 2030
Figure 23: Global Artificial Intelligence Market Absolute $ Opportunity (US$ Bn), by Services, 2020 – 2030
Figure 24: Global Artificial Intelligence Market Value Share Analysis, by Application, 2020
Figure 25: Global Artificial Intelligence Market Value Share Analysis, by Application, 2030
Figure 26: Global Artificial Intelligence Market Absolute $ Opportunity (US$ Bn), by Virtual Assistants/Chatbots, 2020 – 2030
Figure 27: Global Artificial Intelligence Market Absolute $ Opportunity (US$ Bn), by Forecasts & Modelling, 2020 – 2030
Figure 28: Global Artificial Intelligence Market Absolute $ Opportunity (US$ Bn), by Text Analytics, 2020 – 2030
Figure 29: Global Artificial Intelligence Market Absolute $ Opportunity (US$ Bn), by Speech Analytics, 2020 – 2030
Figure 30: Global Artificial Intelligence Market Absolute $ Opportunity (US$ Bn), by Computer Vision, 2020 – 2030
Figure 31: Global Artificial Intelligence Market Absolute $ Opportunity (US$ Bn), by Predictive Maintenance, 2020 – 2030
Figure 32: Global Artificial Intelligence Market Value Share Analysis, by End-user, 2020
Figure 33: Global Artificial Intelligence Market Value Share Analysis, by End-user, 2030
Figure 34: Global Artificial Intelligence Market Absolute $ Opportunity (US$ Bn), BFSI, 2020 – 2030
Figure 35: Global Artificial Intelligence Market Absolute $ Opportunity (US$ Bn), IT & Telecom, 2020 – 2030
Figure 36: Global Artificial Intelligence Market Absolute $ Opportunity (US$ Bn), by Manufacturing, 2020 – 2030
Figure 37: Global Artificial Intelligence Market Absolute $ Opportunity (US$ Bn), by Retail & E-commerce, 2020 – 2030
Figure 38: Global Artificial Intelligence Market Absolute $ Opportunity (US$ Bn), by Healthcare, 2020 – 2030
Figure 39: Global Artificial Intelligence Market Absolute $ Opportunity (US$ Bn), by Government, 2020 – 2030
Figure 40: Global Artificial Intelligence Market Absolute $ Opportunity (US$ Bn), by Energy & Utilities, 2020 – 2030
Figure 41: Global Artificial Intelligence Market Absolute $ Opportunity (US$ Bn), by Media & Entertainment, 2020 – 2030
Figure 42: Global Artificial Intelligence Market Opportunity (US$ Bn), by Region
Figure 43: Global Artificial Intelligence Market Opportunity Share (%), by Region, 2020–2030
Figure 44: Global Artificial Intelligence Market Size (US$ Bn), by Region, 2020 & 2030
Figure 45: Global Artificial Intelligence Market Value Share Analysis, by Region, 2020
Figure 46: Global Artificial Intelligence Market Value Share Analysis, by Region, 2030
Figure 47: North America Artificial Intelligence Market Absolute $ Opportunity (US$ Bn), 2020 – 2030
Figure 48: Europe Artificial Intelligence Market Absolute $ Opportunity (US$ Bn), 2020 – 2030
Figure 49: Asia Pacific Artificial Intelligence Market Absolute $ Opportunity (US$ Bn), 2020 – 2030
Figure 50: Middle East & Africa Artificial Intelligence Market Absolute $ Opportunity (US$ Bn), 2020 – 2030
Figure 51: South America Artificial Intelligence Market Absolute $ Opportunity (US$ Bn), 2020 – 2030
Figure 52: North America Artificial Intelligence Market Revenue Opportunity Share, by Application
Figure 53: North America Artificial Intelligence Market Revenue Opportunity Share, by End-user
Figure 54: North America Artificial Intelligence Market Revenue Opportunity Share, by Component
Figure 55: North America Artificial Intelligence Market Revenue Opportunity Share, by Country
Figure 56: North America Artificial Intelligence Market Value Share Analysis, by Component, 2020
Figure 57: North America Artificial Intelligence Market Value Share Analysis, by Component, 2030
Figure 58: North America Artificial Intelligence Market Absolute $ Opportunity (US$ Bn), by Hardware, 2020 – 2030
Figure 59: North America Artificial Intelligence Market Absolute $ Opportunity (US$ Bn), by Software, 2020 – 2030
Figure 60: North America Artificial Intelligence Market Absolute $ Opportunity (US$ Bn), by Services, 2020 – 2030
Figure 61: North America Artificial Intelligence Market Value Share Analysis, by Application, 2020
Figure 62: North America Artificial Intelligence Market Value Share Analysis, by Application, 2030
Figure 63: North America Artificial Intelligence Market Absolute $ Opportunity (US$ Bn), by Virtual Assistants/Chatbots, 2020 – 2030
Figure 64: North America Artificial Intelligence Market Absolute $ Opportunity (US$ Bn), by Forecasts & Modelling, 2020 – 2030
Figure 65: North America Artificial Intelligence Market Absolute $ Opportunity (US$ Bn), by Text Analytics, 2020 – 2030
Figure 66: North America Artificial Intelligence Market Absolute $ Opportunity (US$ Bn), by Speech Analytics, 2020 – 2030
Figure 67: North America Artificial Intelligence Market Absolute $ Opportunity (US$ Bn), by Computer Vision, 2020 – 2030
Figure 68: North America Artificial Intelligence Market Absolute $ Opportunity (US$ Bn), by Predictive Maintenance, 2020 – 2030
Figure 69: North America Artificial Intelligence Market Value Share Analysis, by End-user, 2020
Figure 70: North America Artificial Intelligence Market Value Share Analysis, by End-user, 2030
Figure 71: North America Artificial Intelligence Market Absolute $ Opportunity (US$ Bn), BFSI, 2020 – 2030
Figure 72: North America Artificial Intelligence Market Absolute $ Opportunity (US$ Bn), IT & Telecom, 2020 – 2030
Figure 73: North America Artificial Intelligence Market Absolute $ Opportunity (US$ Bn), by Manufacturing, 2020 – 2030
Figure 74: North America Artificial Intelligence Market Absolute $ Opportunity (US$ Bn), by Retail & E-commerce, 2020 – 2030
Figure 75: North America Artificial Intelligence Market Absolute $ Opportunity (US$ Bn), by Healthcare, 2020 – 2030
Figure 76: North America Artificial Intelligence Market Absolute $ Opportunity (US$ Bn), by Government, 2020 – 2030
Figure 77: North America Artificial Intelligence Market Absolute $ Opportunity (US$ Bn), by Energy & Utilities, 2020 – 2030
Figure 78: North America Artificial Intelligence Market Absolute $ Opportunity (US$ Bn), by Media & Entertainment, 2020 – 2030
Figure 79: North America Artificial Intelligence Market Value Share Analysis, by Country, 2020
Figure 80: North America Artificial Intelligence Market Value Share Analysis, by Country, 2030
Figure 81: U.S. Artificial Intelligence Market Opportunity Growth Analysis (US$ Bn) Forecast, 2020 – 2030
Figure 82: Canada Artificial Intelligence Market Opportunity Growth Analysis (US$ Bn) Forecast, 2020 – 2030
Figure 83: Mexico Artificial Intelligence Market Opportunity Growth Analysis (US$ Bn) Forecast, 2020 – 2030
Figure 84: Europe Artificial Intelligence Market Revenue Opportunity Share, by Application
Figure 85: Europe Artificial Intelligence Market Revenue Opportunity Share, by End-user
Figure 86: Europe Artificial Intelligence Market Revenue Opportunity Share, by Component
Figure 87: Europe Artificial Intelligence Market Revenue Opportunity Share, by Country
Figure 88: Europe Artificial Intelligence Market Value Share Analysis, by Component, 2020
Figure 89: Europe Artificial Intelligence Market Value Share Analysis, by Component, 2030
Figure 90: Europe Artificial Intelligence Market Absolute $ Opportunity (US$ Bn), by Hardware, 2020 – 2030
Figure 91: Europe Artificial Intelligence Market Absolute $ Opportunity (US$ Bn), by Software, 2020 – 2030
Figure 92: Europe Artificial Intelligence Market Absolute $ Opportunity (US$ Bn), by Services, 2020 – 2030
Figure 93: Europe Artificial Intelligence Market Value Share Analysis, by Application, 2020
Figure 94: Europe Artificial Intelligence Market Value Share Analysis, by Application, 2030
Figure 95: Europe Artificial Intelligence Market Absolute $ Opportunity (US$ Bn), by Virtual Assistants/Chatbots, 2020 – 2030
Figure 96: Europe Artificial Intelligence Market Absolute $ Opportunity (US$ Bn), by Forecasts & Modelling, 2020 – 2030
Figure 97: Europe Artificial Intelligence Market Absolute $ Opportunity (US$ Bn), by Text Analytics, 2020 – 2030
Figure 98: Europe Artificial Intelligence Market Absolute $ Opportunity (US$ Bn), by Speech Analytics, 2020 – 2030
Figure 99: Europe Artificial Intelligence Market Absolute $ Opportunity (US$ Bn), by Computer Vision, 2020 – 2030
Figure 100: Europe Artificial Intelligence Market Absolute $ Opportunity (US$ Bn), by Predictive Maintenance, 2020 – 2030
Figure 101: Europe Artificial Intelligence Market Value Share Analysis, by End-user, 2020
Figure 102: Europe Artificial Intelligence Market Value Share Analysis, by End-user, 2030
Figure 103: Europe Artificial Intelligence Market Absolute $ Opportunity (US$ Bn), BFSI, 2020 – 2030
Figure 104: Europe Artificial Intelligence Market Absolute $ Opportunity (US$ Bn), IT & Telecom, 2020 – 2030
Figure 105: Europe Artificial Intelligence Market Absolute $ Opportunity (US$ Bn), by Manufacturing, 2020 – 2030
Figure 106: Europe Artificial Intelligence Market Absolute $ Opportunity (US$ Bn), by Retail & E-commerce, 2020 – 2030
Figure 107: Europe Artificial Intelligence Market Absolute $ Opportunity (US$ Bn), by Healthcare, 2020 – 2030
Figure 108: Europe Artificial Intelligence Market Absolute $ Opportunity (US$ Bn), by Government, 2020 – 2030
Figure 109: Europe Artificial Intelligence Market Absolute $ Opportunity (US$ Bn), by Energy & Utilities, 2020 – 2030
Figure 110: Europe Artificial Intelligence Market Absolute $ Opportunity (US$ Bn), by Media & Entertainment, 2020 – 2030
Figure 111: Europe Artificial Intelligence Market Value Share Analysis, by Country, 2020
Figure 112: Europe Artificial Intelligence Market Value Share Analysis, by Country, 2030
Figure 113: Germany Artificial Intelligence Market Opportunity Growth Analysis (US$ Bn) Forecast, 2020 – 2030
Figure 114: U.K. Artificial Intelligence Market Opportunity Growth Analysis (US$ Bn) Forecast, 2020 – 2030
Figure 115: France Artificial Intelligence Market Opportunity Growth Analysis (US$ Bn) Forecast, 2020 – 2030
Figure 116: Spain Artificial Intelligence Market Opportunity Growth Analysis (US$ Bn) Forecast, 2020 – 2030
Figure 117: Italy Artificial Intelligence Market Opportunity Growth Analysis (US$ Bn) Forecast, 2020 – 2030
Figure 118: Asia Pacific Artificial Intelligence Market Revenue Opportunity Share, by Application
Figure 119: Asia Pacific Artificial Intelligence Market Revenue Opportunity Share, by End-user
Figure 120: Asia Pacific Artificial Intelligence Market Revenue Opportunity Share, by Component
Figure 121: Asia Pacific Artificial Intelligence Market Revenue Opportunity Share, by Country
Figure 122: Asia Pacific Artificial Intelligence Market Value Share Analysis, by Component, 2020
Figure 123: Asia Pacific Artificial Intelligence Market Value Share Analysis, by Component, 2030
Figure 124: Asia Pacific Artificial Intelligence Market Absolute $ Opportunity (US$ Bn), by Hardware, 2020 – 2030
Figure 126: Asia Pacific Artificial Intelligence Market Absolute $ Opportunity (US$ Bn), by Software, 2020 – 2030
Figure 127: Asia Pacific Artificial Intelligence Market Absolute $ Opportunity (US$ Bn), by Services, 2020 – 2030
Figure 128: Asia Pacific Artificial Intelligence Market Value Share Analysis, by Application, 2020
Figure 129: Asia Pacific Artificial Intelligence Market Value Share Analysis, by Application, 2030
Figure 130: Asia Pacific Artificial Intelligence Market Absolute $ Opportunity (US$ Bn), by Virtual Assistants/Chatbots, 2020 – 2030
Figure 131: Asia Pacific Artificial Intelligence Market Absolute $ Opportunity (US$ Bn), by Forecasts & Modelling, 2020 – 2030
Figure 132: Asia Pacific Artificial Intelligence Market Absolute $ Opportunity (US$ Bn), by Text Analytics, 2020 – 2030
Figure 133: Asia Pacific Artificial Intelligence Market Absolute $ Opportunity (US$ Bn), by Speech Analytics, 2020 – 2030
Figure 134: Asia Pacific Artificial Intelligence Market Absolute $ Opportunity (US$ Bn), by Computer Vision, 2020 – 2030
Figure 135: Asia Pacific Artificial Intelligence Market Absolute $ Opportunity (US$ Bn), by Predictive Maintenance, 2020 – 2030
Figure 136: Asia Pacific Artificial Intelligence Market Value Share Analysis, by End-user, 2020
Figure 137: Asia Pacific Artificial Intelligence Market Value Share Analysis, by End-user, 2030
Figure 138: Asia Pacific Artificial Intelligence Market Absolute $ Opportunity (US$ Bn), BFSI, 2020 – 2030
Figure 139: Asia Pacific Artificial Intelligence Market Absolute $ Opportunity (US$ Bn), IT & Telecom, 2020 – 2030
Figure 140: Asia Pacific Artificial Intelligence Market Absolute $ Opportunity (US$ Bn), by Manufacturing, 2020 – 2030
Figure 141: Asia Pacific Artificial Intelligence Market Absolute $ Opportunity (US$ Bn), by Retail & E-commerce, 2020 – 2030
Figure 142: Asia Pacific Artificial Intelligence Market Absolute $ Opportunity (US$ Bn), by Healthcare, 2020 – 2030
Figure 143: Asia Pacific Artificial Intelligence Market Absolute $ Opportunity (US$ Bn), by Government, 2020 – 2030
Figure 144: Asia Pacific Artificial Intelligence Market Absolute $ Opportunity (US$ Bn), by Energy & Utilities, 2020 – 2030
Figure 145: Asia Pacific Artificial Intelligence Market Absolute $ Opportunity (US$ Bn), by Media & Entertainment, 2020 – 2030
Figure 146: Asia Pacific Artificial Intelligence Market Value Share Analysis, by Country, 2020
Figure 147: Asia Pacific Artificial Intelligence Market Value Share Analysis, by Country, 2030
Figure 148: China Artificial Intelligence Market Opportunity Growth Analysis (US$ Bn) Forecast, 2020 – 2030
Figure 149: India Artificial Intelligence Market Opportunity Growth Analysis (US$ Bn) Forecast, 2020 – 2030
Figure 150: Japan Artificial Intelligence Market Opportunity Growth Analysis (US$ Bn) Forecast, 2020 – 2030
Figure 151: ASEAN Artificial Intelligence Market Opportunity Growth Analysis (US$ Bn) Forecast, 2020 – 2030
Figure 152: Middle East & Africa Artificial Intelligence Market Revenue Opportunity Share, by Application
Figure 153: Middle East & Africa Artificial Intelligence Market Revenue Opportunity Share, by End-user
Figure 154: Middle East & Africa Artificial Intelligence Market Revenue Opportunity Share, by Component
Figure 155: Middle East & Africa Artificial Intelligence Market Revenue Opportunity Share, by Country
Figure 156: Middle East & Africa Artificial Intelligence Market Value Share Analysis, by Component, 2020
Figure 157: Middle East & Africa Artificial Intelligence Market Value Share Analysis, by Component, 2030
Figure 158: Middle East & Africa Artificial Intelligence Market Absolute $ Opportunity (US$ Bn), by Hardware, 2020 – 2030
Figure 159: Middle East & Africa Artificial Intelligence Market Absolute $ Opportunity (US$ Bn), by Software, 2020 – 2030
Figure 160: Middle East & Africa Artificial Intelligence Market Absolute $ Opportunity (US$ Bn), by Services, 2020 – 2030
Figure 161: Middle East & Africa Artificial Intelligence Market Value Share Analysis, by Application, 2020
Figure 162: Middle East & Africa Artificial Intelligence Market Value Share Analysis, by Application, 2030
Figure 163: Middle East & Africa Artificial Intelligence Market Absolute $ Opportunity (US$ Bn), by Virtual Assistants/Chatbots, 2020 – 2030
Figure 164: Middle East & Africa Artificial Intelligence Market Absolute $ Opportunity (US$ Bn), by Forecasts & Modelling, 2020 – 2030
Figure 165: Middle East & Africa Artificial Intelligence Market Absolute $ Opportunity (US$ Bn), by Text Analytics, 2020 – 2030
Figure 166: Middle East & Africa Artificial Intelligence Market Absolute $ Opportunity (US$ Bn), by Speech Analytics, 2020 – 2030
Figure 167: Middle East & Africa Artificial Intelligence Market Absolute $ Opportunity (US$ Bn), by Computer Vision, 2020 – 2030
Figure 168: Middle East & Africa Artificial Intelligence Market Absolute $ Opportunity (US$ Bn), by Predictive Maintenance, 2020 – 2030
Figure 169: Middle East & Africa Artificial Intelligence Market Value Share Analysis, by End-user, 2020
Figure 170: Middle East & Africa Artificial Intelligence Market Value Share Analysis, by End-user, 2030
Figure 171: Middle East & Africa Artificial Intelligence Market Absolute $ Opportunity (US$ Bn), BFSI, 2020 – 2030
Figure 172: Middle East & Africa Artificial Intelligence Market Absolute $ Opportunity (US$ Bn), IT & Telecom, 2020 – 2030
Figure 173: Middle East & Africa Artificial Intelligence Market Absolute $ Opportunity (US$ Bn), by Manufacturing, 2020 – 2030
Figure 174: Middle East & Africa Artificial Intelligence Market Absolute $ Opportunity (US$ Bn), by Retail & E-commerce, 2020 – 2030
Figure 175: Middle East & Africa Artificial Intelligence Market Absolute $ Opportunity (US$ Bn), by Healthcare, 2020 – 2030
Figure 176: Middle East & Africa Artificial Intelligence Market Absolute $ Opportunity (US$ Bn), by Government, 2020 – 2030
Figure 177: Middle East & Africa Artificial Intelligence Market Absolute $ Opportunity (US$ Bn), by Energy & Utilities, 2020 – 2030
Figure 178: Middle East & Africa Artificial Intelligence Market Absolute $ Opportunity (US$ Bn), by Media & Entertainment, 2020 – 2030
Figure 179: Middle East & Africa Artificial Intelligence Market Value Share Analysis, by Country, 2020
Figure 180: Middle East & Africa Artificial Intelligence Market Value Share Analysis, by Country, 2030
Figure 181: UAE Artificial Intelligence Market Opportunity Growth Analysis (US$ Bn) Forecast, 2020 – 2030
Figure 182: Saudi Arabia Artificial Intelligence Market Opportunity Growth Analysis (US$ Bn) Forecast, 2020 – 2030
Figure 183: South Africa Artificial Intelligence Market Opportunity Growth Analysis (US$ Bn) Forecast, 2020 – 2030
Figure 184: South America Artificial Intelligence Market Revenue Opportunity Share, by Application
Figure 185: South America Artificial Intelligence Market Revenue Opportunity Share, by End-user
Figure 186: South America Artificial Intelligence Market Revenue Opportunity Share, by Component
Figure 187: South America Artificial Intelligence Market Revenue Opportunity Share, by Country
Figure 188: South America Artificial Intelligence Market Value Share Analysis, by Component, 2020
Figure 189: South America Artificial Intelligence Market Value Share Analysis, by Component, 2030
Figure 190: South America Artificial Intelligence Market Absolute $ Opportunity (US$ Bn), by Hardware, 2020 – 2030
Figure 191: South America Artificial Intelligence Market Absolute $ Opportunity (US$ Bn), by Software, 2020 – 2030
Figure 192: South America Artificial Intelligence Market Absolute $ Opportunity (US$ Bn), by Services, 2020 – 2030
Figure 193: South America Artificial Intelligence Market Value Share Analysis, by Application, 2020
Figure 194: South America Artificial Intelligence Market Value Share Analysis, by Application, 2030
Figure 195: South America Artificial Intelligence Market Absolute $ Opportunity (US$ Bn), by Virtual Assistants/Chatbots, 2020 – 2030
Figure 196: South America Artificial Intelligence Market Absolute $ Opportunity (US$ Bn), by Forecasts & Modelling, 2020 – 2030
Figure 197: South America Artificial Intelligence Market Absolute $ Opportunity (US$ Bn), by Text Analytics, 2020 – 2030
Figure 198: South America Artificial Intelligence Market Absolute $ Opportunity (US$ Bn), by Speech Analytics, 2020 – 2030
Figure 199: South America Artificial Intelligence Market Absolute $ Opportunity (US$ Bn), by Computer Vision, 2020 – 2030
Figure 200: South America Artificial Intelligence Market Absolute $ Opportunity (US$ Bn), by Predictive Maintenance, 2020 – 2030
Figure 201: South America Artificial Intelligence Market Value Share Analysis, by End-user, 2020
Figure 202: South America Artificial Intelligence Market Value Share Analysis, by End-user, 2030
Figure 203: South America Artificial Intelligence Market Absolute $ Opportunity (US$ Bn), BFSI, 2020 – 2030
Figure 204: South America Artificial Intelligence Market Absolute $ Opportunity (US$ Bn), IT & Telecom, 2020 – 2030
Figure 205: South America Artificial Intelligence Market Absolute $ Opportunity (US$ Bn), by Manufacturing, 2020 – 2030
Figure 206: South America Artificial Intelligence Market Absolute $ Opportunity (US$ Bn), by Retail & E-commerce, 2020 – 2030
Figure 207: South America Artificial Intelligence Market Absolute $ Opportunity (US$ Bn), by Healthcare, 2020 – 2030
Figure 208: South America Artificial Intelligence Market Absolute $ Opportunity (US$ Bn), by Government, 2020 – 2030
Figure 209: South America Artificial Intelligence Market Absolute $ Opportunity (US$ Bn), by Energy & Utilities, 2020 – 2030
Figure 210: South America Artificial Intelligence Market Absolute $ Opportunity (US$ Bn), by Media & Entertainment, 2020 – 2030
Figure 211: South America Artificial Intelligence Market Value Share Analysis, by Country, 2020
Figure 212: South America Artificial Intelligence Market Value Share Analysis, by Country, 2030
Figure 213: Brazil Artificial Intelligence Market Opportunity Growth Analysis (US$ Bn) Forecast, 2020 – 2030
Copyright © Transparency Market Research, Inc. All Rights reserved
Trust Online

Artificial Intelligence Market Insights, 2020-2030
