The protein pharmaceutical space has gradually matured into a multibillion-dollar industry over the past couple of decades. However, identifying the ideal bio-therapeutic development cell lines has posed as a major barrier in the manufacturing process. Biotherapeutic cell line development has reached new frontiers, owing to considerable genomic research and development activities. In addition, existing as well as emerging technologies in the biotherapeutics cell line development have played an integral role in pushing cell engineering toward new frontiers. Over the past couple of decades, considerable work has been put in toward optimization of codons and construction of vectors due to which, biotherapeutics cell line development has garnered noteworthy attention.
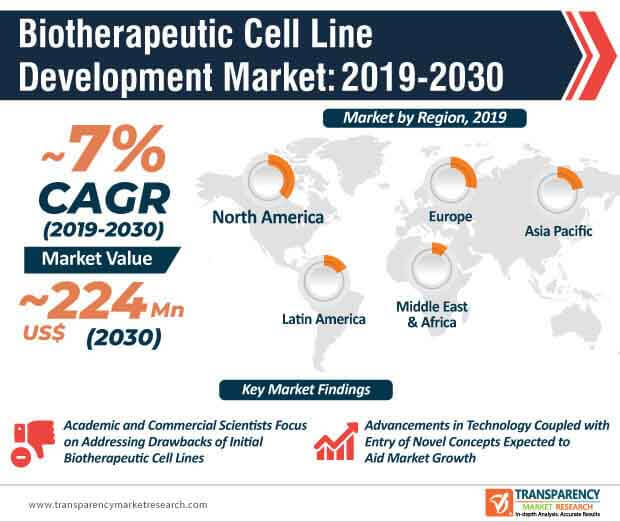
Regulatory changes, introduction of new technologies, and advent of an array of innovative concepts have played a key role in influencing the overall growth of the global biotherapeutics cell line development market over the past few years– a trend that is expected to continue during the forecast period. Over the past few decades, academic and commercial scientists have largely focused on addressing the shortcomings of initial formulations of biotherapeutics cell lines. Several companies operating in the current biotherapeutics cell line development market landscape are introducing new variants of cell line development solutions to cater to industrial requirements.
At the back of these factors, along with consistent rise in the number of investments, the global biotherapeutics cell line development market is expected to reach ~US$ 224 Mn by 2030. Apart from these factors, the growing support offered by government bodies around the world to promote biotechnology and the pharmaceutical industry is another factor that is expected to set the tone for the development of the global biotherapeutics cell line development market during the assessment period.
As the protein pharmaceutical industry continues to take giant strides in the forward direction, it has a direct impact on the growth of the biotherapeutics cell line development market. For the longest time, Chinese Hamster Ovary (CHO) cells have remained the most popular expression system for biotherapeutics cell line development, as it is accepted by the FDA and thereby, makes the regulatory approval an easy process. In addition, these biotherapeutics cell lines have the ability to grow in suspension, resistant to viral infection, and are relatively easier to work with. These factors are expected to play a key role in the progress of the global biotherapeutics cell line development market during the assessment period.
However, at present, market players are increasingly focusing on streamlining the process of segregating high-producing protein secretors from low-producing protein secretors, which are highly tedious and time-consuming as over thousands of clones are screened in a period of few weeks. However, the onset of the multi-open reading frame (ORF) constructs in cells could possibly lead to a compromise, fragmented DNA being integrated into the genome in place of the requisite sequence. Market players operating in the current market for biotherapeutics cell line development are increasingly focusing on streamlining segregation processes to fast-track cell line development. At present, the pursuit of novel biopharmaceutical agents continues to remain one of the most critical challenges in the pharmaceutical research and drug development sphere.
Biotherapeutic cell line development plays a critical role in these research activities. However, at present, researchers and scientists are largely focusing on addressing the numerous challenges involved with cell lines such as quality, robustness, productivity, scaling-up, etc.
Over the past decade, a number of organizations involved in the biotherapeutics cell line development market are highly inclined toward the development of new technologies that enable the production and manufacturing of various innovative biopharmaceuticals, including gene therapy vectors and complex therapeutic cell lines. In addition, several market participants are also roping in considerable efforts to fast-track screening and biotherapeutics cell line development to develop high-end biopharmaceutical solutions, including complex fusion proteins, viral particles, and largely glycosylated plasma proteins.
Several market players are launching new workflow models to optimize the identification process of top clones for complex antibody therapeutics. For instance, in March 2020, Berkeley Light launched the cell line development 2.0 workflow to identify the most ideal clones for complex antibody therapeutics. The newly launched Opto CLD 2.0 workflow allows the measurement of antibody production in over thousands of clones by utilizing the company’s assays. With a similar aim to increase lab productivity and minimize the timeline of biotherapeutics cell line development, in June 2019, Sartorius Stedim Biotech launched a new generation cell culture micro-bioreactor system.
The COVID-19 pandemic is currently playing a huge role in derailing the world economy, as industries and businesses around the world continue to remain shut due to social distancing norms and lockdowns enforced by governments. While several industrial sectors are witnessing minimal activity during the COVID-19 event, the pharmaceutical sector is currently burdened with the demand for effective solutions and products to combat the COVID-19 infection. Several players operating in the current biotherapeutics cell line development market are investing in research and development activities to combat the COVID-19 virus. Market players are expected to look beyond the conventional means of antibody-drug manufacturing and discover novel ways to enhance productivity. Several market players are currently collaborating with scientists to discover potential solutions to prevent the spread of the COVID-19 infection. While the market is likely to witness steady growth in 2020 due to the COVID-19 event, all eyes will be on research and development activities.
Analysts’ Viewpoint
The global biotherapeutics cell line development market is expected to grow at a CAGR of ~7% during the forecast period. The market growth will be largely driven by research and development activities due to which, new solutions and technologies have gradually entered the market. Developments in the pharmaceutical sector will ideally focus on enhancing lab productivity and minimizing the overall time taken for biotherapeutics cell line development. While the COVID-19 pandemic will disrupt operations and workflow models across the biotherapeutics cell line development market, it presents an opportunity for market participants to focus on research activities that explore the possibilities of non-conventional antibody manufacturing techniques.
Biotherapeutics cell line development market is expected to reach ~US$ 224 Mn by 2030
Biotherapeutics cell line development market is expected to grow at a CAGR of ~7% during 2020 - 2030
Biotherapeutics cell line development market is driven by rise in the demand for biotherapeutics led by the recent launches of biopharmaceutical drugs
North America accounted for a major share of the global biotherapeutics cell line development market and the trend is expected to continue during the forecast period
Key players in the global biotherapeutics cell line development market include Merck KGaA, Becton, Dickinson and Company (BD), Danaher Corporation
1. Preface
1.1. Market Definition and Scope
1.2. Market Segmentation
1.3. Key Research Objectives
1.4. Research Highlights
2. Assumptions and Research Methodology
3. Executive Summary: Global Biotherapeutics Cell Line Development Market
4. Market Overview
4.1. Introduction
4.1.1. Process Definition
4.1.2. Industry Evolution / Developments
4.2. Overview
4.3. Market Dynamics
4.3.1. Drivers
4.3.2. Restraints
4.3.3. Opportunities
4.4. Global Biotherapeutics Cell Line Development Market Analysis and Forecast, 2018–2030
4.4.1. Market Revenue Projections (US$ Mn)
5. Key Insights
5.1. Key Mergers & Acquisitions
5.2. Overview of Cell Line Development Process for Biotherapeutics
5.3. COVID-19 Pandemics Impact on Industry (Value Chain and Short / Mid / Long Term Impact)
6. Global Biotherapeutics Cell Line Development Market Analysis and Forecast, by Process
6.1. Introduction & Definition
6.2. Key Findings / Developments
6.3. Market Value Forecast, by Process, 2018–2030
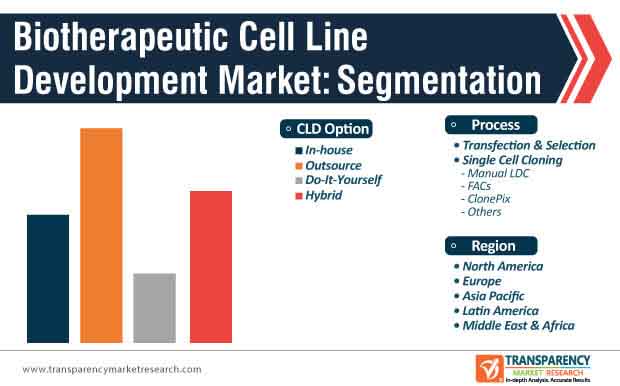
6.3.1. Transfection & Selection
6.3.2. Single Cell Cloning
6.3.2.1. Manual LDC
6.3.2.2. FACs
6.3.2.3. ClonePix
6.3.2.4. Others
6.4. Market Attractiveness, by Process, 2020-2030
7. Global Biotherapeutics Cell Line Development Market Analysis and Forecast, by CLD Option
7.1. Introduction & Definition
7.2. Key Findings / Developments
7.3. Market Value Forecast, by CLD Option, 2018–2030
7.3.1. In-house
7.3.2. Outsource
7.3.3. Do-It-Yourself
7.3.4. Hybrid
7.4. Market Attractiveness, by CLD Option, 2020-2030
8. Global Biotherapeutics Cell Line Development Market Analysis and Forecast, by Region
8.1. Key Findings
8.2. Market Value Forecast, by Region
8.2.1. North America
8.2.2. Europe
8.2.3. Asia Pacific
8.2.4. Latin America
8.2.5. Middle East & Africa
8.3. Market Attractiveness, by Country/Region, 2020-2030
9. North America Biotherapeutics Cell Line Development Market Analysis and Forecast
9.1. Introduction
9.1.1. Key Findings
9.2. Market Value Forecast, by Process, 2018–2030
9.2.1. Transfection & Selection
9.2.2. Single Cell Cloning
9.2.2.1. Manual LDC
9.2.2.2. FACs
9.2.2.3. ClonePix
9.2.2.4. Others
9.3. Market Value Forecast, by CLD Option, 2018–2030
9.3.1. In-house
9.3.2. Outsource
9.3.3. Do-It-Yourself
9.3.4. Hybrid
9.4. Market Value Forecast, by Country, 2018–2030
9.4.1. U.S.
9.4.2. Canada
9.5. Market Attractiveness Analysis, 2020-2030
9.5.1. By Process
9.5.2. By CLD Option
9.5.3. By Country
10. Europe Biotherapeutics Cell Line Development Market Analysis and Forecast
10.1. Introduction
10.1.1. Key Findings
10.2. Market Value Forecast, by Process, 2018–2030
10.2.1. Transfection & Selection
10.2.2. Single Cell Cloning
10.2.2.1. Manual LDC
10.2.2.2. FACs
10.2.2.3. ClonePix
10.2.2.4. Others
10.3. Market Value Forecast, by CLD Option, 2018–2030
10.3.1. In-house
10.3.2. Outsource
10.3.3. Do-It-Yourself
10.3.4. Hybrid
10.4. Market Value Forecast, by Country/Sub-region, 2018–2030
10.4.1. Germany
10.4.2. U.K.
10.4.3. France
10.4.4. Spain
10.4.5. Italy
10.4.6. Rest of Europe
10.5. Market Attractiveness Analysis, 2020-2030
10.5.1. By Process
10.5.2. By CLD Option
10.5.3. By Country/Sub-region
11. Asia Pacific Biotherapeutics Cell Line Development Market Analysis and Forecast
11.1. Introduction
11.1.1. Key Findings
11.2. Market Value Forecast, by Process, 2018–2030
11.2.1. Transfection & Selection
11.2.2. Single Cell Cloning
11.2.2.1. Manual LDC
11.2.2.2. FACs
11.2.2.3. ClonePix
11.2.2.4. Others
11.3. Market Value Forecast, by CLD Option, 2018–2030
11.3.1. In-house
11.3.2. Outsource
11.3.3. Do-It-Yourself
11.3.4. Hybrid
11.4. Market Value Forecast, by Country/Sub-region, 2018–2030
11.4.1. China
11.4.2. Japan
11.4.3. India
11.4.4. Australia & New Zealand
11.4.5. Rest of Asia Pacific
11.5. Market Attractiveness Analysis, 2020-2030
11.5.1. By Process
11.5.2. By CLD Option
11.5.3. By Country/Sub-region
12. Latin America Biotherapeutics Cell Line Development Market Analysis and Forecast
12.1. Introduction
12.1.1. Key Findings
12.2. Market Value Forecast, by Process, 2018–2030
12.2.1. Transfection & Selection
12.2.2. Single Cell Cloning
12.2.2.1. Manual LDC
12.2.2.2. FACs
12.2.2.3. ClonePix
12.2.2.4. Others
12.3. Market Value Forecast, by CLD Option, 2018–2030
12.3.1. In-house
12.3.2. Outsource
12.3.3. Do-It-Yourself
12.3.4. Hybrid
12.4. Market Value Forecast, by Country/Sub-region, 2018–2030
12.4.1. Brazil
12.4.2. Mexico
12.4.3. Rest of Latin America
12.5. Market Attractiveness Analysis, 2020-2030
12.5.1. By Process
12.5.2. By CLD Option
12.5.3. By Country/Sub-region
13. Middle East & Africa Biotherapeutics Cell Line Development Market Analysis and Forecast
13.1. Introduction
13.1.1. Key Findings
13.2. Market Value Forecast, by Process, 2018–2030
13.2.1. Transfection & Selection
13.2.2. Single Cell Cloning
13.2.2.1. Manual LDC
13.2.2.2. FACs
13.2.2.3. ClonePix
13.2.2.4. Others
13.3. Market Value Forecast, by CLD Option, 2018–2030
13.3.1. In-house
13.3.2. Outsource
13.3.3. Do-It-Yourself
13.3.4. Hybrid
13.4. Market Value Forecast, by Country/Sub-region, 2018–2030
13.4.1. GCC Countries
13.4.2. South Africa
13.4.3. Rest of Middle East & Africa
13.5. Market Attractiveness Analysis, 2020-2030
13.5.1. By Process
13.5.2. By CLD Option
13.5.3. By Country/Sub-region
14. Competition Landscape
14.1. Market Player – Competition Matrix (By Tier and Size of companies)
14.2. Market Share Analysis, by Company (2019)
14.3. Company Profiles
14.3.1. Merck KGaA
14.3.1.1. Company Overview (HQ, Business Segments, Employee Strength)
14.3.1.2. Company Financials
14.3.1.3. Growth Strategies
14.3.1.4. SWOT Analysis
14.3.2. Becton, Dickinson and Company (BD)
14.3.2.1. Company Overview (HQ, Business Segments, Employee Strength)
14.3.2.2. Company Financials
14.3.2.3. Growth Strategies
14.3.2.4. SWOT Analysis
14.3.3. Danaher Corporation
14.3.3.1. Company Overview (HQ, Business Segments, Employee Strength)
14.3.3.2. Company Financials
14.3.3.3. Growth Strategies
14.3.3.4. SWOT Analysis
14.3.4. Boehringer Ingelheim Group
14.3.4.1. Company Overview (HQ, Business Segments, Employee Strength)
14.3.4.2. Company Financials
14.3.4.3. Growth Strategies
14.3.4.4. SWOT Analysis
14.3.5. Thermo Fisher Scientific Inc.
14.3.5.1. Company Overview (HQ, Business Segments, Employee Strength)
14.3.5.2. Company Financials
14.3.5.3. Growth Strategies
14.3.5.4. SWOT Analysis
14.3.6. Lonza Group Ltd.
14.3.6.1. Company Overview (HQ, Business Segments, Employee Strength)
14.3.6.2. Company Financials
14.3.6.3. Growth Strategies
14.3.6.4. SWOT Analysis
14.3.7. ProBioGen AG
14.3.7.1. Company Overview (HQ, Business Segments, Employee Strength)
14.3.7.2. Company Financials
14.3.7.3. Growth Strategies
14.3.7.4. SWOT Analysis
14.3.8. Solentim Ltd.
14.3.8.1. Company Overview (HQ, Business Segments, Employee Strength)
14.3.8.2. Company Financials
14.3.8.3. Growth Strategies
14.3.8.4. SWOT Analysis
14.3.9. Selexis SA
14.3.9.1. Company Overview (HQ, Business Segments, Employee Strength)
14.3.9.2. Company Financials
14.3.9.3. Growth Strategies
14.3.9.4. SWOT Analysis
14.3.10. Sysmex Corporation
14.3.10.1. Company Overview (HQ, Business Segments, Employee Strength)
14.3.10.2. Company Financials
14.3.10.3. Growth Strategies
14.3.10.4. SWOT Analysis
List of Tables
Table 01: Key Mergers, Acquisitions, and Strategic Partnership
Table 02: Global Biotherapeutics Cell Line Development Market Value (US$ Mn) Forecast, by Process, 2018–2030
Table 03: Global Biotherapeutics Cell Line Development Market Value (US$ Mn) Forecast, by Single Cell Cloning, 2018–2030
Table 04: Global Biotherapeutics Cell Line Development Market Value (US$ Mn) Forecast, by CLD Option, 2018–2030
Table 05: Global Biotherapeutics Cell Line Development Market Value (US$ Mn) Forecast, by Region, 2018–2030
Table 06: North America Biotherapeutics Cell Line Development Market Value (US$ Mn) Forecast, by Country, 2018–2030
Table 07: North America Biotherapeutics Cell Line Development Market Value (US$ Mn) Forecast, by Process, 2018–2030
Table 08: North America Biotherapeutics Cell Line Development Market Value (US$ Mn) Forecast, by Single Cell Cloning, 2018–2030
Table 09: North America Biotherapeutics Cell Line Development Market Value (US$ Mn) Forecast, by CLD Option, 2018–2030
Table 10: Europe Biotherapeutics Cell Line Development Market Value (US$ Mn) Forecast, by Country/Sub-region, 2018–2030
Table 11: Europe Biotherapeutics Cell Line Development Market Value (US$ Mn) Forecast, by Process, 2018–2030
Table 12: Europe Biotherapeutics Cell Line Development Market Value (US$ Mn) Forecast, by Single Cell Cloning, 2018–2030
Table 13: Europe Biotherapeutics Cell Line Development Market Value (US$ Mn) Forecast, by CLD Option, 2018–2030
Table 14: Asia Pacific Biotherapeutics Cell Line Development Market Value (US$ Mn) Forecast, by Country/Sub-region, 2018–2030
Table 15: Asia Pacific Biotherapeutics Cell Line Development Market Value (US$ Mn) Forecast, by Process, 2018–2030
Table 16: Asia Pacific Biotherapeutics Cell Line Development Market Value (US$ Mn) Forecast, by Single Cell Cloning, 2018–2030
Table 17: Asia Pacific Biotherapeutics Cell Line Development Market Value (US$ Mn) Forecast, by CLD Option, 2018–2030
Table 18: Latin America Biotherapeutics Cell Line Development Market Value (US$ Mn) Forecast, by Country/Sub-region, 2018–2030
Table 19: Latin America Biotherapeutics Cell Line Development Market Value (US$ Mn) Forecast, by Process, 2018–2030
Table 20: Latin America Biotherapeutics Cell Line Development Market Value (US$ Mn) Forecast, by Single Cell Cloning, 2018–2030
Table 21: Latin America Biotherapeutics Cell Line Development Market Value (US$ Mn) Forecast, by CLD Option, 2018–2030
Table 22: Middle East & Africa Biotherapeutics Cell Line Development Market Value (US$ Mn) Forecast, by Country/Sub-region, 2018–2030
Table 23: Middle East & Africa Biotherapeutics Cell Line Development Market Value (US$ Mn) Forecast, by Process, 2018–2030
Table 24: Middle East & Africa Biotherapeutics Cell Line Development Market Value (US$ Mn) Forecast, by Single Cell Cloning, 2018–2030
Table 25: Middle East & Africa Biotherapeutics Cell Line Development Market Value (US$ Mn) Forecast, by CLD Option, 2018–2030
List of Figures
Figure 01: Global Biotherapeutics Cell Line Development Market Value (US$ Mn) and Distribution, by Region, 2019 and 2030
Figure 02: Global Biotherapeutics Cell Line Development Market Value (US$ Mn) Forecast, 2018–2030
Figure 03: Global Biotherapeutics Cell Line Development Market Value Share, by Process, 2019
Figure 04: Global Biotherapeutics Cell Line Development Market Value Share, by CLD Option, 2019
Figure 05: Global Biotherapeutics Cell Line Development Market Value Share, by Single Cell Cloning, 2019
Figure 06: Global Biotherapeutics Cell Line Development Market Value Share, by Region, 2019
Figure 07: Biotherapeutics Workflow
Figure 08: Global Biotherapeutics Cell Line Development Market Value Share Analysis, by Process, 2019 and 2030
Figure 09: Global Biotherapeutics Cell Line Development Market Revenue (US$ Mn) and Y-o-Y Growth (%), by Transfection & Selection, 2018-2030
Figure 10: Global Biotherapeutics Cell Line Development Market Revenue (US$ Mn) and Y-o-Y Growth (%), by Single Cell Cloning, 2018-2030
Figure 11: Global Biotherapeutics Cell Line Development Market Attractiveness Analysis, by Process, 2020–2030
Figure 12: Global Biotherapeutics Cell Line Development Market Value Share Analysis, by CLD Option, 2019 and 2030
Figure 13: Global Biotherapeutics Cell Line Development Market Revenue (US$ Mn) and Y-o-Y Growth (%), by In-house, 2018-2030
Figure 14: Global Biotherapeutics Cell Line Development Market Revenue (US$ Mn) and Y-o-Y Growth (%), by Outsource, 2018-2030
Figure 15: Global Biotherapeutics Cell Line Development Market Revenue (US$ Mn) and Y-o-Y Growth (%), by Do-It-Yourself, 2018-2030
Figure 16: Global Biotherapeutics Cell Line Development Market Revenue (US$ Mn) and Y-o-Y Growth (%), by Hybrid, 2018-2030
Figure 17: Global Biotherapeutics Cell Line Development Market Attractiveness Analysis, by CLD Option, 2020-2030
Figure 18: Global Biotherapeutics Cell Line Development Market Value Share, by Region, 2019 and 2030
Figure 19: Global Biotherapeutics Cell Line Development Market Attractiveness, by Region, 2020–2030
Figure 20: North America Biotherapeutics Cell Line Development Market Value (US$ Mn) Forecast and Y-o-Y Growth Projection (%), 2018–2030
Figure 21: North America Biotherapeutics Cell Line Development Market Value Share, by Country, 2019 and 2030
Figure 22: North America Biotherapeutics Cell Line Development Market Attractiveness, by Country, 2020–2030
Figure 23: North America Biotherapeutics Cell Line Development Market Value Share, by Process, 2019 and 2030
Figure 24: North America Biotherapeutics Cell Line Development Market Attractiveness, by Process, 2020–2030
Figure 25: North America Biotherapeutics Cell Line Development Market Value Share, by CLD Option, 2019 and 2030
Figure 26: North America Biotherapeutics Cell Line Development Market Attractiveness, by CLD Option, 2020–2030
Figure 27: Europe Biotherapeutics Cell Line Development Market Value (US$ Mn) Forecast and Y-o-Y Growth Projection (%), 2018–2030
Figure 28: Europe Biotherapeutics Cell Line Development Market Value Share Analysis, by Country/Sub-region, 2019 and 2030
Figure 29: Europe Biotherapeutics Cell Line Development Market Attractiveness Analysis, by Country/sub-region, 2020–2030
Figure 30: Europe Biotherapeutics Cell Line Development Market Value Share, by Process, 2019 and 2030
Figure 31: Europe Biotherapeutics Cell Line Development Market Attractiveness, by Process, 2020–2030
Figure 32: Europe Biotherapeutics Cell Line Development Market Value Share, by CLD Option, 2019 and 2030
Figure 33: Europe Biotherapeutics Cell Line Development Market Attractiveness, by CLD Option, 2020–2030
Figure 34: Asia Pacific Biotherapeutics Cell Line Development Market Value (US$ Mn) Forecast and Y-o-Y Growth Projection (%), 2018–2030
Figure 35: Asia Pacific Biotherapeutics Cell Line Development Market Value Share Analysis, by Country/Sub-region, 2019 and 2030
Figure 36: Asia Pacific Biotherapeutics Cell Line Development Market Attractiveness Analysis, by Country/sub-region,
Figure 37: Asia Pacific Biotherapeutics Cell Line Development Market Value Share, by Process, 2019 and 2030
Figure 38: Asia Pacific Biotherapeutics Cell Line Development Market Attractiveness, by Process, 2020–2030
Figure 39: Asia Pacific Biotherapeutics Cell Line Development Market Value Share, by CLD Option, 2019 and 2030
Figure 40: Asia Pacific Biotherapeutics Cell Line Development Market Attractiveness, by CLD Option, 2020–2030
Figure 41: Latin America Biotherapeutics Cell Line Development Market Value (US$ Mn) Forecast and Y-o-Y Growth Projection (%), 2018–2030
Figure 42: Latin America Biotherapeutics Cell Line Development Market Value Share, by Country/Sub-region, 2019 and 2030
Figure 43: Latin America Biotherapeutics Cell Line Development Market Attractiveness, by Country/sub-region, 2020–2030
Figure 44: Latin America Biotherapeutics Cell Line Development Market Value Share, by Process, 2019 and 2030
Figure 45: Latin America Biotherapeutics Cell Line Development Market Attractiveness, by Process, 2020–2030
Figure 46: Latin America Biotherapeutics Cell Line Development Market Value Share, by CLD Option, 2019 and 2030
Figure 47: Latin America Biotherapeutics Cell Line Development Market Attractiveness, by CLD Option, 2020–2030
Figure 48: Middle East & Africa Biotherapeutics Cell Line Development Market Value (US$ Mn) Forecast and Y-o-Y Growth Projection (%), 2018–2030
Figure 49: Middle East & Africa Biotherapeutics Cell Line Development Market Value Share, by Country/Sub-region, 2019 and 2030
Figure 50: Middle East & Africa Biotherapeutics Cell Line Development Market Attractiveness, by Country/sub-region, 2020–2030
Figure 51: Middle East & Africa Biotherapeutics Cell Line Development Market Value Share, by Process, 2019 and 2030
Figure 52: Middle East & Africa Biotherapeutics Cell Line Development Market Attractiveness, by Process, 2020–2030
Figure 53: Middle East & Africa Biotherapeutics Cell Line Development Market Value Share, by CLD Option, 2019 and 2030
Figure 54: Middle East & Africa Biotherapeutics Cell Line Development Market Attractiveness, by CLD Option, 2020–2030
Figure 55: Market Position/Ranking Analysis, 2018, by Tier and Size of the Company
Figure 56: Merck KGaA, Revenue (US$ Mn) and Y-o-Y Growth (%), 2016–2019
Figure 57: Merck KGaA, Breakdown of Net Sales (%), by Geography, 2019
Figure 58: Merck KGaA, Breakdown of Net Sales (%), by Business Segment, 2019
Figure 59: Merck KGaA, R&D Expenses (US$ Mn) and Y-o-Y Growth (%), 2016–2019
Figure 60: BD Revenue (US$ Mn) and Y-o-Y Growth (%), 2016–2019
Figure 61: BD Breakdown of Net Sales (%), by Region/Country, 2019
Figure 62: BD Revenue Breakdown of Net Sales (%), by Life Sciences Segment, 2019
Figure 63: BD R&D Expenses (US$ Mn) and Y-o-Y Growth (%), 2016–2018
Figure 64: Danaher Corporation, Revenue (US$ Mn) and Y-o-Y Growth (%), 2016–2019
Figure 65: Danaher Corporation, Breakdown of Net Sales (%), by Geography, 2019
Figure 66: Danaher Corporation, Breakdown of Net Sales (%), by Business Segment, 2019
Figure 67: Danaher Corporation, R&D Expenses (US$ Mn) and Y-o-Y Growth (%), 2016–2019
Figure 68: Boehringer Ingelheim Group, Revenue (US$ Mn) and Y-o-Y Growth (%), 2016–2019
Figure 69: Boehringer Ingelheim Group, Breakdown of Net Sales (%), by Geography, 2019
Figure 70: Boehringer Ingelheim Group, Breakdown of Net Sales (%), by Business Segment, 2019
Figure 71: Boehringer Ingelheim Group, R&D Expenses (US$ Mn) and Y-o-Y Growth (%), 2016–2019
Figure 72: Thermo Fisher Scientific Inc., Revenue (US$ Mn) and Y-o-Y Growth (%), 2016–2019
Figure 73: Thermo Fisher Scientific Inc., Breakdown of Net Sales (%), by Geography, 2019
Figure 74: Thermo Fisher Scientific Inc., Breakdown of Net Sales (%), by Business Segment, 2019
Figure 75: Thermo Fisher Scientific Inc., R&D Expenses (US$ Mn) and Y-o-Y Growth (%), 2016–2019
Figure 76: Lonza Group Ltd., Revenue (US$ Mn) and Y-o-Y Growth (%), 2016–2019
Figure 77: Lonza Group Ltd., Breakdown of Net Sales (%), by Geography, 2019
Figure 78: Lonza Group Ltd., Breakdown of Net Sales (%), by Business Segment, 2019
Figure 79: Lonza Group Ltd., R&D Expenses (US$ Mn) and Y-o-Y Growth (%), 2016–2019
Figure 80: Sysmex Corporation, Revenue (US$ Mn) and Y-o-Y Growth (%), 2016–2019
Figure 81: Sysmex Corporation, Breakdown of Net Sales (%), by Geography, 2019
Figure 82: Sysmex Corporation, Breakdown of Net Sales (%), by Business Segment, 2019
Figure 83: Sysmex Corporation, R&D Expenses (US$ Mn) and Y-o-Y Growth (%), 2016–2019
Copyright © Transparency Market Research, Inc. All Rights reserved
Trust Online

Biotherapeutics Cell Line Development Market
