Osteosynthesis Devices Market
The key factor responsible for the rising demand for osteosynthesis devices is the growing prevalence of osteoarthritis and osteoporosis. Both medical issues have a considerable public health burden as they occur commonly among the geriatric population around the world. The rise in the number of patients suffering from these conditions is directly related to the growing population of the elderly. Osteoarthritis, termed by major medical organizations as one of the leading disabling diseases in developed countries, can add severe limitations to the movement and mobility of a patient. Therefore, treatment of the disease is pertinent to the overall geriatric demographic wellbeing.
Outside of the elderly population, there are several factors that drastically increase the chances of a patient suffering from osteoarthritis, including obesity and physical injuries. As such, a rise in the number of obese people, especially in developed nations, is a highly concerning factor for healthcare agencies and a major driver for the production and development of osteosynthesis devices. The number of road accidents and sports injuries is also increasing around the world, adding to the probability of an increase in the demand for osteosynthesis devices in the coming years.
Osteosynthesis devices, however, have quite often been subject to product recalls in recent past, severely reducing their overall usability and market growth.
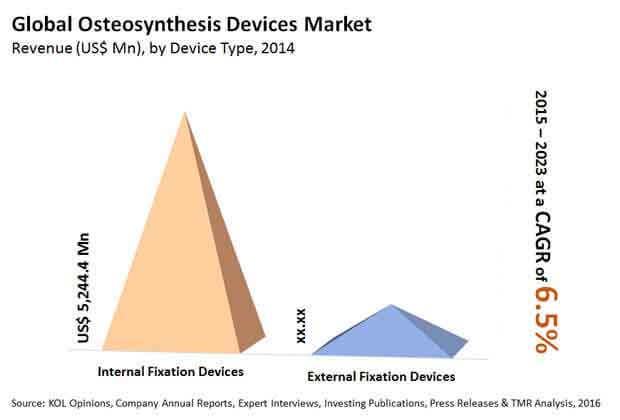
A culmination of the above factors along with other minor drivers and restraints is likely to result in a CAGR of 6.5% for the global osteosynthesis devices market revenue from 2015 to 2023. By the end of 2016, this revenue is expected to reach US$6.69 bn, and US$11.09 bn by the end of 2023.
North America Demand for Osteosynthesis Devices Soars as Elderly Population Increases
By the end of 2023, the revenue generated from North America by manufacturers of osteosynthesis devices is expected to reach US$4.7 bn. This falls in place with the consistent dominance shown by the region in terms of demand. The key reason for this high demand is the large number of geriatrics in the region. Additionally, the large presence of key players and the high investments in osteosynthesis by governments have also added to the growth in demand for osteosynthesis devices in the region. Osteosynthesis devices are mostly available at premium prices in both North America and Europe. This has not deterred purchasers as the use of premium osteosynthesis devices provides a higher level of treatments to be made available for a problem that is already exceedingly high in priority.
Meanwhile, Asia Pacific is showing a significantly high demand for osteosynthesis devices, owing to a high population density and a rapidly increasing healthcare infrastructure and reach. This region’s revenue from osteosynthesis devices is expanding at a CAGR of 8.3% from 2015 to 2023. It is therefore considered as the most lucrative region by key players.

Non-degradable Materials Continue Dominating Market Demand
Degradable and non-degradable are the two major types of material categories in use to make osteosynthesis devices. Of these, non-degradable materials already have a long history of use in osteosynthesis devices and orthopedic implants. They are most commonly inclusive of cobalt-chromium alloys, stainless steels, and titanium. At the moment, the overall growth rate and demand for non-degradable osteosynthesis devices is quite high, owing to the utility-based advantages they provide. Titanium, for instance, is considered as the most biocompatible metal and offers high indices of elasticity, strength, and corrosion resistance.
However, non-degradable devices are connected to a higher rate of transmitting infections, thus complicating a patient’s health and increasing the chances for a second surgery. As a result, larger healthcare organizations are pushing for the use of degradable osteosynthesis devices that offer a one-time use and therefore considerably reduce the chances of infections. The future of osteosynthesis devices could very well be based in the development of degradable materials.
The key manufacturers of osteosynthesis devices across the world include DePuy Synthes, Zimmer Biomet, Stryker Corporation, Smith & Nephew, Neosteo SAS, and Aesculap, Inc.
List of Figures
FIG. 1 Osteosynthesis Devices: Market Segmentation
FIG. 2 Global Osteosynthesis Devices Market, by Geography, 2014 (USD Million)
FIG. 3 Porter’s Five Forces Analysis: Global Osteosynthesis Devices Market
FIG. 4 Market Attractiveness Analysis: Global Osteosynthesis Devices Market, by Geography
FIG. 5 Value Chain Analysis: Global Osteosynthesis Devices Market
FIG. 6 Market Share Analysis: Osteosynthesis Devices Market, by Key Players (Value %)
FIG. 7 Global Degradable Material Market Revenue, 2013 – 2023 (USD Million)
FIG. 8 Global Non-Degradable Material Market Revenue, 2013 – 2023 (USD Million)
FIG. 9 Global Screws and Plates Market Revenue, 2013 – 2023 (USD Million)
FIG. 10 Global Wires and Pins Market Revenue, 2013 – 2023 (USD Million)
FIG. 11 Global Intramedullary Rods and Nails Market Revenue, 2013 – 2023 (USD Million)
FIG. 12 Global Spinal Fixation Devices Market Revenue, 2013 – 2023 (USD Million)
FIG. 13 Global Radius Fracture Fixation Devices Market Revenue, 2013 – 2023 (USD Million)
FIG. 14 Global Tibial Fracture Fixation Devices Market Revenue, 2013 – 2023 (USD Million)
FIG. 15 Global Pelvis Fracture Fixation Devices Market Revenue, 2013 – 2023 (USD Million)
FIG. 16 Global Bone Lengthening Devices Market Revenue, 2013 – 2023 (USD Million)
FIG. 17 Global Ilizarov Devices Market Revenue, 2013 – 2023 (USD Million)
FIG. 18 B. Braun Melsungen AG: Annual Revenue, 2012–2014 (USD Million)
FIG. 19 Johnson and Johnson: Annual Revenue, 2012–2014 (USD Million)
FIG. 20 Globus Medical, Inc.: Annual Revenue, 2012–2014 (USD Million)
FIG. 21 MicroPort Orthopedics, Inc.: Annual Revenue, 2012–2014 (USD million)
FIG. 22 Smith & Nephew plc: Annual Revenue, 2012–2014 (USD Million)
FIG. 23 Stryker Corporation: Annual Revenue: 2012–2014 (USD Million)
FIG. 24 Zimmer Biomet Holdings, Inc.: Annual Revenue, 2012–2014 (USD Million)