Mobile Virtual Network Operator Market: Innovation
Explosion of use of digital technologies for business communication and everyday functioning is expanding avenues in the mobile virtual network operator market. Vendors in mobile virtual network operator (MVNO) market are capitalizing on changing practices of business functioning for internal and external communication. Conceptualized to provide cellular services on the existing infrastructure of other mobile network operators (MNO), this allows vendors in the MVNO market to provide low cost services to consumers. This attracts investments and participation of cellular service providers of all sizes to provide service on the MVNO model, collectively translating into growth in the mobile virtual network operator market.
Advancements in cellular infrastructure and support extended by MNOs serves to expand vistas in the MVNO market. For example, in Europe, government regulations mandate cellular service providers to support MVNOs by means of increased telecommunication spectrum for use. Additional bandwidth of the 3G telecommunication spectrum has helped MVNOs to better serve their customers. For example, this has allowed network operators to provide categorized services to niche business segments. MVNOs have been able to provide cheap rates for international calling that has been well-received by people to stay connected with family and friends at a low cost.
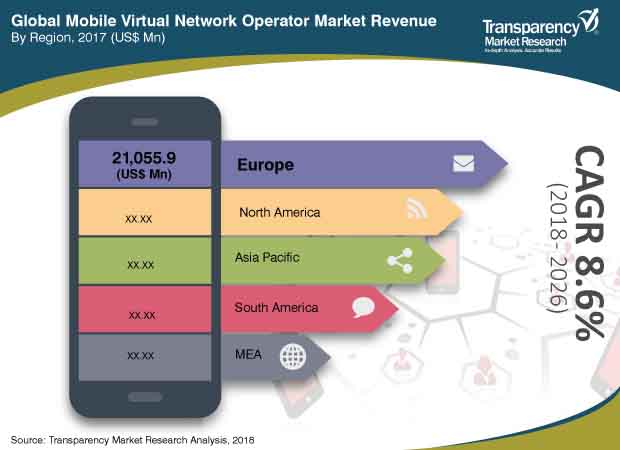
The MVNO market is segmented on the basis of operational model, subscriber, type, and geography. Europe led the MVNO market in the recent past and is expected to continue to remain at the forefront in the coming years. Key factor behind supremacy of the region is government rules and regulations. Product launches and business partnerships between cellular network service providers further strengthens the MVNO market in the region.
Asia Pacific is pacing as a key region in the MVNO market. Rapid advancements in cellular network services along with deployment of a number of service models in emerging economies is fuelling the MVNO market in the region.
Mobile Virtual Network Operator Market - Snapshot
Mobile virtual network operator (MVNO) is an entity which provides cellular services by using the existing infrastructure of any other mobile network operator (MNO). MVNO has its own data and voice plans, cost structure, and customer handling system. MVNOs provide low cost services to consumers. In addition, operators earn money through the rented spectrum used by MVNOs. Governing bodies are encouraging MVNOs to reduce the expenditure on household communications and promote efficient usage of the full spectrum. MVNOs provide customized services to consumers which are tailor-made to the requirements of consumers. The number of MVNOs is rising globally due to the support of governments and increased competition in the mobile network market. The global MVNO market was valued at US$ 47,090.1 Mn in 2017 and is forecast to grow at a CAGR of 8.6% from 2018 to 2026 reaching a value of US$ 98,438.4 Mn by 2026.
MNOs are supporting MVNOs to earn extra money through rent and also to deal with the competition from other network operators. In regions such as Europe, government rules and regulations have made it compulsory for operators to support MVNOs with increased spectrum available for usage. Additional bandwidth from the 3G spectrum has helped MVNOs to provide quality services to their customers. Network operators are able to provide categorized services to niche segments in the market. Cheap calling rates internationally have helped people from the same ethnicity to stay in touch with their family and friends at a low cost.
Customers using the services of MVNOs are indirectly utilizing the operator’s network. Customer acquisition has become easier and cheaper for network operators as promotional costs have reduced with the help of MVNOs. MVNOs have their own customer service system helping in building a strong relationship with the customers.
The global mobile virtual network operator market has been segmented on the basis of operational model, type, subscriber, and geography. On the basis of operational model, the market is segmented into reseller MVNO, service operator MVNO, and full MVNO. Mature markets in the mobile phone service segment are likely to experience a decline in terms of number of MVNOs launched. In contrast, fast developing markets are trying to accommodate MVNOs much earlier into their mobile network system which will result in increased number of MVNOs launched.
Based on type, the market is classified into discount, telecom, migrant, M2M, business, retail, media, and roaming. Discount was the largest segment of the MVNO market in 2017. Customers are trying to gain low cost calling services provided by the discount MVNOs. Migrant MVNOs are gaining popularity through customized services provided to communities from the same ethnicity. M2M is considered the most promising type of MVNO due to high traction being gained by connectivity of machines and devices.
In terms of region, Europe led the MVNO market in 2017 and is expected to remain dominant throughout the forecast period from 2018 to 2026. The primary driver for the MVNO market in Europe is the government rules and regulations. Asia Pacific and South America are anticipated to experience promising growth in the MVNO market in the coming years. In an interesting development, the mature MVNO markets in the Asia Pacific region such as Korea, Japan, Hong Kong, Malaysia, and Australia have now been overtaken by newcomer, China. The China MVNO market has developed into the largest and most promising one. There are also three Asia Pacific countries to keep an eye on: Vietnam, Indonesia, and Philippines.
The global mobile virtual network operator market is largely driven by product launches and partnerships. For instance, in January 2017, Virgin Mobile renewed its five-year deal with BT’s EE Limited to provide wholesale mobile services. Under this partnership, EE Limited is projected to offer wholesale mobile network services to Virgin Mobile for an unrevealed price. In December 2017, Virgin Mobile announced the launch of ‘Recommend’ in Dubai to help customers get more value from their mobile plans.
Key players profiled in the report include AT&T Inc., Lycamobile Group, Sprint Corporation, T-Mobile AG, Verizon Communications Inc., CITIC Telecom International Holding Limited, Telefonica S.A., Tracfone Wireless, Inc., Truphone Limited, and Virgin Mobile.
1. Preface
1.1. Market Scope
1.2. Market Segmentation
1.3. Key Research Objectives
2. Assumptions and Research Methodology
2.1. Market Taxonomy - Segment Definitions
2.2. Research Methodology
2.2.1. List of Primary and Secondary Sources
2.3. Key Assumptions for Data Modelling
3. Executive Summary : Global Mobile Virtual Network Operator Market
4. Market Overview
4.1. Introduction
4.2. Global Market – Macro Economic Factors Overview
4.2.1. World GDP Indicator – For Top 20 Economies
4.2.2. Global ICT Spending (US$ Mn), 2012, 2018, 2026
4.3. Type/Product Roadmap
4.4. Market Factor Analysis
4.4.1. Porter’s Five Forces Analysis
4.4.2. PESTEL Analysis
4.4.3. Ecosystem Analysis
4.5. Market Dynamics (Growth Influencers)
4.5.1. Drivers
4.5.2. Restraints
4.5.3. Opportunities
4.5.4. Impact Analysis of Drivers & Restraints
4.6. Regulations and Policies – By Region
4.7. Global Mobile Virtual Network Operator Market Analysis and Forecast, 2016 - 2026
4.7.1. Market Revenue Analysis (US$ Mn)
4.7.1.1. Historic growth trends, 2012-2017
4.7.1.2. Forecast trends, 2018-2026
4.8. Market Opportunity Analysis – By Region/Country (Global/North America/Europe/Asia Pacific/Middle East & Africa/South America)
4.8.1. By Region/Country
4.8.2. By Operational Model
4.8.3. By Type
4.8.4. By Subscribers
4.9. Market Outlook
Mobile Internet Penetration (2018), By Region
4.10. Mobile Subscriber Penetration (2018), By Region
4.11. Competitive Scenario and Trends
4.11.1. Mobile Virtual Network Operator Market Concentration Rate
4.11.1.1. List of New Entrants
4.11.2. Mergers & Acquisitions, Expansions
5. Global Mobile Virtual Network Operator Market Analysis and Forecast, By Operational Model
5.1. Overview& Definitions
5.2. Key Segment Analysis
5.3. Mobile Virtual Network Operator Market Size (US$ Mn) Forecast, By Operational Model, 2016 - 2026
5.3.1. Branded Reseller
5.3.2. Service Provider
5.3.3. Full MVNO
6. Global Mobile Virtual Network Operator Market Analysis and Forecast, By Type
6.1. Overview& Definitions
6.2. Key Segment Analysis
6.3. Mobile Virtual Network Operator Market Size (US$ Mn) Forecast, By Type, 2016 - 2026
6.3.1. Business
6.3.2. Discount
6.3.3. M2M
6.3.4. Media
6.3.5. Migrant
6.3.6. Retail
6.3.7. Roaming
6.3.8. Telecom
7. Global Mobile Virtual Network Operator Market Analysis and Forecast, By Subscribers
7.1. Overview& Definitions
7.2. Mobile Virtual Network Operator Market Size (US$ Mn) Forecast, By Subscribers, 2016 - 2026
7.2.1. Business
7.2.2. Consumer
8. Global Mobile Virtual Network Operator Market Analysis and Forecast, by Region
8.1. Overview
8.2. Key Segment Analysis
8.3. Mobile Virtual Network Operator Market Size (US$ Mn) Forecast, by Region, 2016 - 2026
8.3.1. North America
8.3.2. Europe
8.3.3. Asia Pacific
8.3.4. Middle East and Africa
8.3.5. South America
9. North America Mobile Virtual Network Operator Market Analysis and Forecast
9.1. Key Findings
9.2. Impact Analysis of Drivers and Restraint
9.3. Mobile Virtual Network Operator Market Size (US$ Mn) Forecast, By Operational Model, 2016 - 2026
9.3.1. Branded Reseller
9.3.2. Service Provider
9.3.3. Full MVNO
9.4. Mobile Virtual Network Operator Market Size (US$ Mn) Forecast, By Type, 2016 - 2026
9.4.1. Business
9.4.2. Discount
9.4.3. M2M
9.4.4. Media
9.4.5. Migrant
9.4.6. Retail
9.4.7. Roaming
9.4.8. Telecom
9.5. Mobile Virtual Network Operator Market Size (US$ Mn) Forecast, By Subscribers, 2016 - 2026
9.5.1. Business
9.5.2. Consumer
9.6. Mobile Virtual Network Operator Market Size (US$ Mn) Forecast, By Country, 2016 - 2026
9.6.1. The U.S.
9.6.2. Canada
9.6.3. Rest of North America
10. Europe Mobile Virtual Network Operator Market Analysis and Forecast
10.1. Key Findings
10.2. Impact Analysis of Drivers and Restraint
10.3. Mobile Virtual Network Operator Market Size (US$ Mn) Forecast, By Operational Model, 2016 - 2026
10.3.1. Branded Reseller
10.3.2. Service Provider
10.3.3. Full MVNO
10.4. Mobile Virtual Network Operator Market Size (US$ Mn) Forecast, By Type, 2016 - 2026
10.4.1. Business
10.4.2. Discount
10.4.3. M2M
10.4.4. Media
10.4.5. Migrant
10.4.6. Retail
10.4.7. Roaming
10.4.8. Telecom
10.5. Mobile Virtual Network Operator Market Size (US$ Mn) Forecast, By Subscribers, 2016 - 2026
10.5.1. Business
10.5.2. Consumer
10.6. Mobile Virtual Network Operator Market Size (US$ Mn) Forecast, By Country, 2016 - 2026
10.6.1. Germany
10.6.2. UK
10.6.3. Rest of Europe
11. Asia Pacific Mobile Virtual Network Operator Market Analysis and Forecast
11.1. Key Findings
11.2. Impact Analysis of Drivers and Restraint
11.3. Mobile Virtual Network Operator Market Size (US$ Mn) Forecast, By Operational Model, 2016 - 2026
11.3.1. Branded Reseller
11.3.2. Service Provider
11.3.3. Full MVNO
11.4. Mobile Virtual Network Operator Market Size (US$ Mn) Forecast, By Type, 2016 - 2026
11.4.1. Business
11.4.2. Discount
11.4.3. M2M
11.4.4. Media
11.4.5. Migrant
11.4.6. Retail
11.4.7. Roaming
11.4.8. Telecom
11.5. Mobile Virtual Network Operator Market Size (US$ Mn) Forecast, By Subscribers, 2016 - 2026
11.5.1. Business
11.5.2. Consumer
11.6. Mobile Virtual Network Operator Market Size (US$ Mn) Forecast, By Country, 2016 - 2026
11.6.1. China
11.6.2. Japan
11.6.3. Rest of Asia Pacific
12. Middle East & Africa (MEA) Mobile Virtual Network Operator Market Analysis and Forecast
12.1. Key Findings
12.2. Impact Analysis of Drivers and Restraint
12.3. Mobile Virtual Network Operator Market Size (US$ Mn) Forecast, By Operational Model, 2016 - 2026
12.3.1. Branded Reseller
12.3.2. Service Provider
12.3.3. Full MVNO
12.4. Mobile Virtual Network Operator Market Size (US$ Mn) Forecast, By Type, 2016 - 2026
12.4.1. Business
12.4.2. Discount
12.4.3. M2M
12.4.4. Media
12.4.5. Migrant
12.4.6. Retail
12.4.7. Roaming
12.4.8. Telecom
12.5. Mobile Virtual Network Operator Market Size (US$ Mn) Forecast, By Subscribers, 2016 - 2026
12.5.1. Business
12.5.2. Consumer
12.6. Mobile Virtual Network Operator Market Size (US$ Mn) Forecast, By Country, 2016 - 2026
12.6.1. GCC
12.6.2. South Africa
12.6.3. Rest of MEA
13. South America Mobile Virtual Network Operator Market Analysis and Forecast
13.1. Key Findings
13.2. Impact Analysis of Drivers and Restraint
13.3. Mobile Virtual Network Operator Market Size (US$ Mn) Forecast, By Operational Model, 2016 - 2026
13.3.1. Branded Reseller
13.3.2. Service Provider
13.3.3. Full MVNO
13.4. Mobile Virtual Network Operator Market Size (US$ Mn) Forecast, By Type, 2016 - 2026
13.4.1. Business
13.4.2. Discount
13.4.3. M2M
13.4.4. Media
13.4.5. Migrant
13.4.6. Retail
13.4.7. Roaming
13.4.8. Telecom
13.5. Mobile Virtual Network Operator Market Size (US$ Mn) Forecast, By Subscribers, 2016 - 2026
13.5.1. Business
13.5.2. Consumer
13.6. Mobile Virtual Network Operator Market Size (US$ Mn) Forecast, By Country, 2016 - 2026
13.6.1. Brazil
13.6.2. Argentina
13.6.3. Rest of South America
14. Competition Landscape
14.1. Market Player – Competition Matrix
14.2. Market Revenue Share Analysis (%), by Company (2017)
15. Company Profiles
15.1. AT&T Inc.
15.1.1. Company Overview
15.1.2. Key Competitors
15.1.3. Geographical Presence
15.1.4. Strategy
15.2. CITIC Telecom International Holdings Ltd.
15.2.1. Company Overview
15.2.2. Key Competitors
15.2.3. Geographical Presence
15.2.4. Strategy
15.3. Lycamobile Group
15.3.1. Company Overview
15.3.2. Key Competitors
15.3.3. Geographical Presence
15.3.4. Strategy
15.4. Sprint Corporation
15.4.1. Company Overview
15.4.2. Key Competitors
15.4.3. Geographical Presence
15.4.4. Strategy
15.5. Telefonica S.A
15.5.1. Company Overview
15.5.2. Key Competitors
15.5.3. Geographical Presence
15.5.4. Strategy
15.6. T-Mobile AG
15.6.1. Company Overview
15.6.2. Key Competitors
15.6.3. Geographical Presence
15.6.4. Strategy
15.7. TracFone Wireless Inc.
15.7.1. Company Overview
15.7.2. Key Competitors
15.7.3. Geographical Presence
15.7.4. Strategy
15.8. Truphone Ltd.
15.8.1. Company Overview
15.8.2. Key Competitors
15.8.3. Geographical Presence
15.8.4. Strategy
15.9. Verizon Communication Inc.
15.9.1. Company Overview
15.9.2. Key Competitors
15.9.3. Geographical Presence
15.9.4. Strategy
15.10. Virgin Mobile
15.10.1. Company Overview
15.10.2. Key Competitors
15.10.3. Geographical Presence
15.10.4. Strategy
16. Key Takeaways
List of Tables
Table 1: Emerging Players, Prominent Players in Mobile Virtual Network Operator Market
Table 2: Mergers & Acquisitions, Expansions
Table 3: Global Mobile Virtual Network Operator Market Value (US$ Mn) and Forecast, by Operational Model, 2016 – 2026
Table 4: Global Mobile Virtual Network Operator Market Value (US$ Mn) and Forecast, By Type, 2016 – 2026
Table 5: Global Mobile Virtual Network Operator Market Value (US$ Mn) and Forecast, by Subscribers, 2016 – 2026
It is notable that the number of MVNOs has grown progressively worldwide over the years, with the U.S, UK and countries in Europe leading the way. Europe is the largest market for MVNOs having huge number of subscribers.
Table 6: Global Mobile Virtual Network Operator Market Value (US$ Mn) and Forecast, by Region, 2016 – 2026
Table 7: North America Mobile Virtual Network Operator Market Value (US$ Mn) and Forecast, by Operational Model, 2016 – 2026
Table 8: North America Mobile Virtual Network Operator Market Value (US$ Mn) and Forecast, By Type, 2016 – 2026
Table 9: North America Mobile Virtual Network Operator Market Value (US$ Mn) and Forecast, by Subscribers, 2016 – 2026
Table 10: North Mobile Virtual Network Operator Market Value (US$ Mn) and Forecast, by Country, 2016 – 2026
Table 11: Europe Mobile Virtual Network Operator Market Value (US$ Mn) and Forecast, by Operational Model, 2016 – 2026
Table 12: Europe Mobile Virtual Network Operator Market Value (US$ Mn) and Forecast, By Type, 2016 – 2026
Table 13: Europe Mobile Virtual Network Operator Market Value (US$ Mn) and Forecast, by Subscribers, 2016 – 2026
Table 14: Europe Mobile Virtual Network Operator Market Value (US$ Mn) and Forecast, by Country, 2016 – 2026
Table 15: Asia Pacific Mobile Virtual Network Operator Market Value (US$ Mn) and Forecast, by Operational Model, 2016 – 2026
Table 16: Asia Pacific Mobile Virtual Network Operator Market Value (US$ Mn) and Forecast, By Type, 2016 – 2026
Table 17: Asia Pacific Mobile Virtual Network Operator Market Value (US$ Mn) and Forecast, by Subscribers, 2016 – 2026
Table 18: Asia Pacific Mobile Virtual Network Operator Market Value (US$ Mn) and Forecast, by Country, 2016 – 2026
Table 19: Middle East & Africa Mobile Virtual Network Operator Market Value (US$ Mn) and Forecast, by Operational Model, 2016 – 2026
Table 20: Middle East & Africa Mobile Virtual Network Operator Market Value (US$ Mn) and Forecast, By Type, 2016 – 2026
The consumer segment is predictable to be the dominant subscribers segment during the forecast period. It is expected to register a CAGR of 6.9% from 2018 to 2026. This growth can be recognized to MVNOs that offer cost effective offerings.
Table 21: Middle East & Africa Mobile Virtual Network Operator Market Value (US$ Mn) and Forecast, by Subscribers, 2016 – 2026
Table 22: Middle East & Africa Mobile Virtual Network Operator Market Value (US$ Mn) and Forecast, by Country, 2016 – 2026
Table 23: South America Mobile Virtual Network Operator Market Value (US$ Mn) and Forecast, by Operational Model, 2016 – 2026
Table 24: South America Mobile Virtual Network Operator Market Value (US$ Mn) and Forecast, By Type, 2016 – 2026
Table 25: South America Mobile Virtual Network Operator Market Value (US$ Mn) and Forecast, by Subscribers, 2016 – 2026
List of Figures
Figure 1: Global Mobile Virtual Network Operator Market Size (US$ Mn) Forecast, 2016–2026
Figure 2: Global Mobile Virtual Network Operator Market Value (US$) Opportunity Assessment, by Region, 2018E
Figure 3: Global Mobile Virtual Network Operator Market Value (US$) Opportunity Assessment, by Region, 2026F
Figure 4: North America Market growth – Snapshot
Figure 5: North America Mobile Virtual Network Operator Market Share Analysis, by Type, 2017
Figure 6: North America Mobile Virtual Network Operator Market Share Analysis, by Operational Model, 2017
Figure 7: North America Mobile Virtual Network Operator Market Share Analysis, by Subscribers, 2017
Figure 8: Europe Market growth – Snapshot
Figure 9: Europe Mobile Virtual Network Operator Market Share Analysis, by Type, 2017
Figure 10: Europe Mobile Virtual Network Operator Market Share Analysis, by Operational Model, 2017
Figure 11: Europe Mobile Virtual Network Operator Market Share Analysis, by Subscriber, 2017
Figure 12: Middle East & Africa Market growth – Snapshot
Figure 13: Middle East & Africa Mobile Virtual Network Operator Market Share Analysis, by Type, 2017
Figure 14: Middle East & Africa Mobile Virtual Network Operator Market Share Analysis, by Operational Model, 2017
Figure 15: Middle East & Africa Mobile Virtual Network Operator Market Share Analysis, by Subscribers, 2017
Figure 16: South America Market growth – Snapshot
Figure 17: South America Mobile Virtual Network Operator Market Share Analysis, by Application, 2017
Figure 18: South America Mobile Virtual Network Operator Market Share Analysis, by Technology, 2017
Figure 19: South America Mobile Virtual Network Operator Market Share Analysis, by Industry, 2017
Figure 20: World GDP Indicator (2017)
Figure 21: Global ICT Spending (US$ Bn)
Figure 22: Top 20 Countries by Household Spending (US$ Mn)
Figure 23: Historic growth trends, 2012-2017 (US$ Mn)
Figure 24: Forecast trends, 2017-2026 (US$ Mn)
Figure 25: Global Mobile Virtual Network Operator Market, Subscribers (US$ Mn), 2016-2026
Figure 26: : Global Mobile Virtual Network Operator Market, ARPU, 2016-2026
Figure 27: Global Mobile Virtual Network Operator Market Attractiveness Assessment, By Operational Model
Figure 28: Global Mobile Virtual Network Operator Market Attractiveness Assessment, By Type
Figure 29: Global Mobile Virtual Network Operator Market Attractiveness Assessment, By Subscribers
Figure 30: Global Mobile Virtual Network Operator Market Attractiveness Assessment, By Region
Figure 31: Opportunity Assessment, By Operational Model
Figure 32: Opportunity Assessment, By Type
Figure 33: Opportunity Assessment, By Subscribers
Figure 34: Opportunity Assessment, By Region
Figure 35: Global Mobile Virtual Network Operator Market Share Analysis, by Operational Model, 2018 and 2026 (Revenue %)
Figure 36: Global Mobile Virtual Network Operator Market Share Analysis, By Type, 2018 and 2026 (Revenue %)
Figure 37: Global Mobile Virtual Network Operator Market Share Analysis, by Subscribers, 2018 and 2026 (Revenue %)
Figure 38: Global Mobile Virtual Network Operator Market Share Analysis, by Region, 2018 and 2026 (Revenue %)
Figure 39: North America Mobile Virtual Network Operator Market Size (US$ Mn) and Y-o-Y Growth (%) Forecast, 2016 – 2026
Figure 40: North America Mobile Virtual Network Operator Market, Subscribers (US$ Mn), 2016-2026
Figure 41: : North America Mobile Virtual Network Operator Market, ARPU, 2016-2026
Figure 42: North America Mobile Virtual Network Operator Market Share Analysis, by Operational Model, 2018 and 2026 (Revenue %)
Figure 43: North America Mobile Virtual Network Operator Market Share Analysis, By Type, 2018 and 2026 (Revenue %)
Figure 44: North America Mobile Virtual Network Operator Market Share Analysis, by Subscribers, 2018 and 2026 (Revenue %)
Figure 45: North America Mobile Virtual Network Operator Market Share Analysis, by Country, 2018 and 2026 (Revenue %)
Figure 46: North America Mobile Virtual Network Operator Opportunity Assessment, By Operational Model (2018-2026)
Figure 47: North America Mobile Virtual Network Operator Opportunity Assessment, By Type (2018-2026)
Figure 48: North America Mobile Virtual Network Operator Opportunity Assessment, By Subscribers (2018-2026)
Figure 49: North America Mobile Virtual Network Operator Opportunity Assessment, By Country (2018-2026)
Figure 50: Europe Mobile Virtual Network Operator Market Size (US$ Mn) and Y-o-Y Growth (%) Forecast, 2016 – 2026
Figure 51: Europe Mobile Virtual Network Operator Market, Subscribers (US$ Mn), 2016-2026
Figure 52: : Europe Mobile Virtual Network Operator Market, ARPU, 2016-2026
Figure 53: Europe Mobile Virtual Network Operator Market Share Analysis, by Operational Model, 2018 and 2026 (Revenue %)
Figure 54: Europe Mobile Virtual Network Operator Market Share Analysis, By Type, 2018 and 2026 (Revenue %)
Figure 55: Europe Mobile Virtual Network Operator Market Share Analysis, by Subscribers, 2018 and 2026 (Revenue %)
Figure 56: Europe Mobile Virtual Network Operator Market Share Analysis, by Country, 2018 and 2026 (Revenue %)
Figure 57: Europe Mobile Virtual Network Operator Opportunity Assessment, By Operational Model (2018-2026)
Figure 58: Europe Mobile Virtual Network Operator Opportunity Assessment, By Type (2018-2026)
Figure 59: Europe Mobile Virtual Network Operator Opportunity Assessment, By Subscribers (2018-2026)
Figure 60: Europe Mobile Virtual Network Operator Opportunity Assessment, By Country (2018-2026)
Figure 61: Asia Pacific Mobile Virtual Network Operator Market Size (US$ Mn) and Y-o-Y Growth (%) Forecast, 2016 – 2026
Figure 62: Asia Pacific Mobile Virtual Network Operator Market, Subscribers (US$ Mn), 2016-2026
Figure 63: Asia Pacific Mobile Virtual Network Operator Market, ARPU, 2016-2026
Figure 64: Asia Pacific Mobile Virtual Network Operator Market Share Analysis, by Operational Model, 2018 and 2026 (Revenue %)
Figure 65: Asia Pacific Mobile Virtual Network Operator Market Share Analysis, By Type, 2018 and 2026 (Revenue %)
Figure 66: Asia Pacific Mobile Virtual Network Operator Market Share Analysis, by Subscribers, 2018 and 2026 (Revenue %)
Figure 67: Asia Pacific Mobile Virtual Network Operator Market Share Analysis, by Country, 2018 and 2026 (Revenue %)
Figure 68: Asia Pacific Mobile Virtual Network Operator Opportunity Assessment, By Operational Model (2018-2026)
Figure 69: Asia Pacific Mobile Virtual Network Operator Opportunity Assessment, By Type (2018-2026)
Figure 70: Asia Pacific Mobile Virtual Network Operator Opportunity Assessment, By Subscribers (2018-2026)
Figure 71: Asia Pacific Mobile Virtual Network Operator Opportunity Assessment, By Country (2018-2026)
Figure 72: Middle East & Africa Mobile Virtual Network Operator Market Size (US$ Mn) and Y-o-Y Growth (%) Forecast, 2016 – 2026
Figure 73: Middle East & Africa Mobile Virtual Network Operator Market, Subscribers (US$ Mn), 2016-2026
Figure 74: Middle East & Africa Mobile Virtual Network Operator Market, ARPU, 2016-2026
Figure 75: Middle East & Africa Mobile Virtual Network Operator Market Share Analysis, by Operational Model, 2018 and 2026 (Revenue %)
Figure 76: Middle East & Africa Mobile Virtual Network Operator Market Share Analysis, By Type, 2018 and 2026 (Revenue %)
Figure 77: Middle East & Africa Mobile Virtual Network Operator Market Share Analysis, by Subscribers, 2018 and 2026 (Revenue %)
Figure 78: Middle East & Africa Mobile Virtual Network Operator Market Share Analysis, by Country, 2018 and 2026 (Revenue %)
Figure 79: Middle East & Africa Mobile Virtual Network Operator Opportunity Assessment, By Operational Model (2018-2026)
Figure 80: Middle East & Africa Mobile Virtual Network Operator Opportunity Assessment, By Type (2018-2026)
Figure 81: Middle East & Africa Mobile Virtual Network Operator Opportunity Assessment, By Subscribers (2018-2026)
Figure 82: Middle East & Africa Mobile Virtual Network Operator Opportunity Assessment, By Country (2018-2026)
Figure 83: South America Mobile Virtual Network Operator Market Size (US$ Mn) and Y-o-Y Growth (%) Forecast, 2016 – 2026
Figure 84: South America Mobile Virtual Network Operator Market, Subscribers (US$ Mn), 2016-2026
Figure 85: South America Mobile Virtual Network Operator Market, ARPU, 2016-2026
Figure 86: South America Mobile Virtual Network Operator Market Share Analysis, by Operational Model, 2018 and 2026 (Revenue %)
Figure 87: South America Mobile Virtual Network Operator Market Share Analysis, By Type, 2018 and 2026 (Revenue %)
Figure 88: South America Mobile Virtual Network Operator Market Share Analysis, by Subscribers, 2018 and 2026 (Revenue %)
Figure 89: South America Mobile Virtual Network Operator Opportunity Assessment, By Operational Model (2018-2026)
Figure 90: South America Mobile Virtual Network Operator Opportunity Assessment, By Type (2018-2026)
Figure 91: South America Mobile Virtual Network Operator Opportunity Assessment, By Subscribers (2018-2026)
Figure 92: South America Mobile Virtual Network Operator Opportunity Assessment, By Country (2018-2026)
Copyright © Transparency Market Research, Inc. All Rights reserved
Trust Online

Mobile Virtual Network Operator (MVNO) Market
